Validating Line Graphs with Precision

Line graphs are a fundamental way to visualize trends and fluctuations in data over time, making them a critical component in dashboards, financial reports, and analytics platforms. However, ensuring their accuracy is not always straightforward—rendering inconsistencies, mismatched data points, and UI distortions can lead to misleading insights. In automated testing, validating line graphs requires more than just verifying numbers; it demands a structured approach that combines API data validation, UI rendering checks, and trend consistency analysis. In this blog post, we'll explore common challenges in line graph testing and outline an effective automation strategy to ensure their accuracy.
Common Issues in Line Graph Testing
Testing line graphs involves more than checking if data is displayed—ensuring accuracy, consistency, and proper rendering across different conditions. Here are some of the most common challenges QA engineers face when verifying line graphs:
Mismatched Data Between API and UI
One of the most frequent issues in line graph testing is data discrepancies between the API response and the UI representation. This can happen due to:
To mitigate this, it's essential to compare API values directly with UI-rendered data, ensuring they align while accounting for acceptable tolerances.
Rendering Variations Across Different Devices or Browsers
The way a graph is displayed can vary depending on the browser, screen resolution, or rendering engine. These variations may lead to:
A combination of DOM-based validations and visual regression testing tools like Applitools or Percy can help catch these inconsistencies before they affect end users.
Trend Inconsistencies and Missing Data Points
Even if individual data points match, the overall trend might still be inaccurate due to:
Validating trends by comparing slopes or calculating percentage changes between consecutive points helps detect such inconsistencies. Additionally, checking the total number of data points in the UI against the API can highlight missing values before they cause misinterpretations.
Automating Line Graph Verification: The Smart Approach
Manually verifying line graphs can be tedious and error-prone, especially when dealing with large datasets or frequent updates. A smart approach to automation ensures that both data accuracy and visual consistency are thoroughly tested. This involves combining API data validation with UI checks while focusing on key aspects such as Data Integrity, Trend Accuracy, Value Accuracy, and Visual Consistency.
Combining API Data Validation and UI Checks
An effective automation strategy involves validating data at both the API and UI levels:
Key Aspects of Automated Line Graph Testing
Step-by-Step Validation Workflow
To ensure the accuracy of a line graph, a structured validation workflow is essential. This approach systematically verifies data integrity, trend consistency, value accuracy, and axis formatting. Below is a step-by-step breakdown of the process:
1. Data Extraction
Before validating a line graph, both API and UI data must be extracted for comparison.
2. Trend Analysis
Once both API and UI datasets are available, the next step is to verify overall trend accuracy.
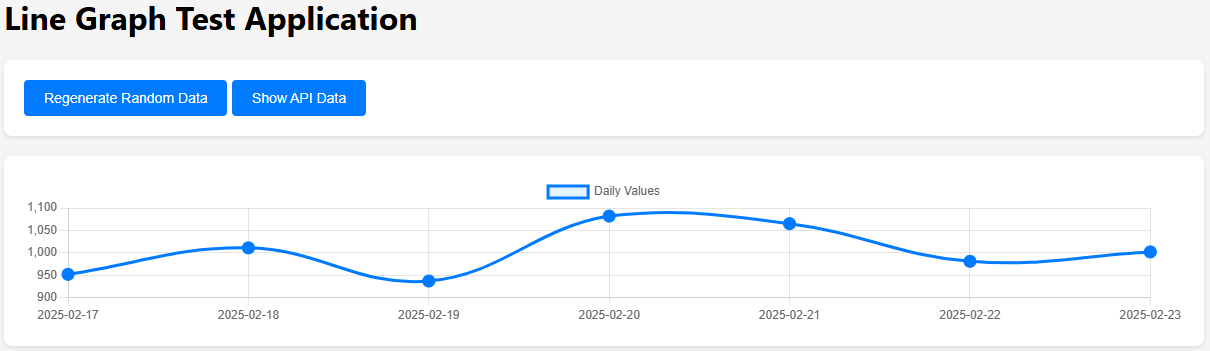
Line Graph Example
3. Threshold-Based Value Comparison
Due to rendering limitations, exact pixel-perfect matches between API and UI values may not always be possible. A tolerance-based approach helps account for these minor differences.
4. Axis Validation
The accuracy of a line graph also depends on proper axis representation.
Robust Error Reporting
Effective error reporting is crucial for debugging line graph discrepancies. When automated validation fails, clear and actionable error messages help us quickly identify the root cause and resolve issues efficiently.
To streamline debugging, error messages should:
Examples of Error Outputs When Validation Fails
1. Data Mismatch Error
[ERROR] Data Mismatch:Expected (API): [120, 135, 150, 160]
Found (UI): [120, 140, 148, 162]
Deviation detected at index 1: Expected 135, but got 140
Possible Causes: UI rendering tolerance exceeded, incorrect data binding.
2. Trend Inconsistency Error
[ERROR] Trend Mismatch:API trend: [Increase, Increase, Stable, Decrease]
UI trend: [Increase, Stable, Increase, Decrease]
Mismatch detected at index 2 (expected Stable, found Increase).
Possible Causes: Missing data point, incorrect interpolation in UI.
3. Axis Label Formatting Error
[ERROR] Axis Label Mismatch:Expected format: YYYY-MM-DD
Found: MM/DD/YYYY
Possible Causes: Incorrect locale settings, inconsistent formatting rules.
By integrating robust error reporting into automated tests, teams can diagnose issues faster, reduce debugging time, and ensure that line graphs accurately reflect the intended data.
Visual Snapshot Testing
Ensuring that a line graph renders correctly across different devices and browsers requires more than just numerical validation—it also demands visual accuracy. Snapshot testing helps detect UI discrepancies by capturing and comparing graph renderings over time.
Automated snapshot testing involves:
For advanced snapshot testing, tools like Applitools, Percy, or Playwright's screenshot comparison can automate visual validation. These tools use AI-powered algorithms to:
Example: Playwright Screenshot Comparison
const { test, expect } = require('@playwright/test');

test('Line graph visual test', async ({ page }) => {
  await page.goto('https://example.com/line-graph');
  const graph = await page.locator('#graph-container');
  expect(await graph.screenshot()).toMatchSnapshot('line-graph.png');
});
This ensures that any visual deviation in the graph is flagged for review.
Handling Real-World Challenges
Automating line graph testing isn't always straightforward. Real-world data visualization comes with challenges like missing data, dynamic updates, and performance concerns. Addressing these issues ensures reliable and scalable test automation.
Addressing Missing Data Points
Missing data can occur due to API limitations, UI rendering issues, or incorrect data mappings. To handle this:
Example Check for Missing Data in API vs. UI
const apiData = [10, 15, null, 20]; // API returns a missing data point
const uiData = await page.$$eval('.line-point', points => points.map(p => p.textContent));

expect(uiData.includes('N/A')).toBeTruthy(); // UI should display 'N/A' for missing data
Managing Dynamic Data Updates & Timezone Differences
Graphs often update dynamically, especially in real-time dashboards. Timezone mismatches between API data and UI display can also cause inconsistencies.
Strategies to handle this:
Example: Handling Timezone Differences
const apiTimestamp = '2025-02-20T12:00:00Z'; // UTC from API
const localTime = new Date(apiTimestamp).toLocaleString('en-US', { timeZone: 'America/New_York' });

expect(await page.locator('#graph-timestamp').textContent()).toContain(localTime);
Optimizing Performance for Large Datasets
When testing large datasets, rendering and DOM processing can slow down UI interactions. Best practices include:
Example: Fetching Only Visible Data Points
const visiblePoints = await page.$$eval('.line-point:visible', points => points.length);
expect(visiblePoints).toBeLessThan(100); // Ensure UI does not overload rendering
Code Example
To ensure that our line graph correctly represents API data, we use Playwright to extract and validate the data points, trends, and axes. Below is a step-by-step breakdown of how the validation is implemented.
1. Defining Data Structures for Graph Validation
We start by defining two data structures:
from dataclasses import dataclass
from typing import List, Dict, Optional
from datetime import datetime
import json
from playwright.async_api import async_playwright, Page

@dataclass
class DataPoint:
    date: datetime
    value: float

@dataclass
class GraphValidationConfig:
    value_tolerance: float = 0.01
    trend_tolerance: float = 0.02
    min_data_points: int = 2
2. Implementing the Line Graph Validator
The LineGraphValidator class is responsible for fetching data, extracting graph points, and validating trends and values.
We initialize the validator with the given configuration.
class LineGraphValidator:
    def __init__(self, config: GraphValidationConfig = GraphValidationConfig()):
        self.config = config
        self._fetch_graph_data = None
3. Fetching Data from the API
We fetch API data and parse it into DataPoint objects.
async def fetch_api_data(self, api_url: str, headers: Optional[Dict] = None) -> List[DataPoint]:
    if self._fetch_graph_data:
        data = await self._fetch_graph_data()
        return [
            DataPoint(
                date=datetime.fromisoformat(point['date']),
                value=float(point['value'])
            )
            for point in data['data']
        ]
    return []
4. Extracting Data from the Graph
We extract data points directly from the rendered Chart.js graph using Playwright's page.evaluate().
async def extract_graph_data(self, page: Page, point_selector: str) -> List[DataPoint]:
    data = await page.evaluate("window.getGraphData()")

    if len(data) < self.config.min_data_points:
        raise ValueError(f"Found fewer than {self.config.min_data_points} data points in graph")

    graph_data = []
    for point in data:
        graph_data.append(DataPoint(
            date=datetime.fromisoformat(point['date']),
            value=float(point['value'])
        ))

    return sorted(graph_data, key=lambda x: x.date)
5. Validating Trends in the Graph
We compare trends in the API data with trends in the graph to ensure consistency.
def validate_trends(self, api_data: List[DataPoint], graph_data: List[DataPoint]) -> bool:

    def calculate_trends(data: List[DataPoint]) -> List[float]:
        return [
            (point2.value - point1.value) / point1.value
            for point1, point2 in zip(data[:-1], data[1:])
        ]

    api_trends = calculate_trends(api_data)
    graph_trends = calculate_trends(graph_data)

    return all(
        abs(api_trend - graph_trend) <= self.config.trend_tolerance
        for api_trend, graph_trend in zip(api_trends, graph_trends)
    )
6. Validating Absolute Values
We ensure that the values displayed in the graph match the API data within the defined tolerance.
def validate_values(self, api_data: List[DataPoint], graph_data: List[DataPoint]) -> bool:
    return all(
        abs(api_point.value - graph_point.value) / api_point.value <= self.config.value_tolerance
        for api_point, graph_point in zip(api_data, graph_data)
    )
7. Validating Graph Axes
We check if the canvas element for the graph exists, ensuring that the graph has rendered correctly.
async def validate_axes(self, page: Page) -> bool:
    canvas = await page.query_selector('canvas#lineGraph')
    return canvas is not None
8. Running the Full Validation
We implement a method that runs all the validation checks and returns the results.
async def validate_graph(self,
                        page: Page,
                        api_url: str,
                        point_selector: str,
                        take_snapshot: bool = False) -> Dict:
    validation_results = {
        'data_integrity': False,
        'trend_accuracy': False,
        'value_accuracy': False,
        'axes_validity': False,
        'visual_consistency': None
    }

    try:

        async def fetch_graph_data():
            data = await page.evaluate("window.getGraphData()")
            return {"data": data}

        self._fetch_graph_data = fetch_graph_data

        api_data = await self.fetch_api_data(api_url)
        graph_data = await self.extract_graph_data(page, point_selector)


        validation_results['data_integrity'] = len(api_data) == len(graph_data)


        validation_results['trend_accuracy'] = self.validate_trends(api_data, graph_data)


        validation_results['value_accuracy'] = self.validate_values(api_data, graph_data)


        validation_results['axes_validity'] = await self.validate_axes(page)


        if take_snapshot:
            await page.screenshot(path=f"graph_snapshot_{datetime.now().strftime('%Y%m%d')}.png")
            validation_results['visual_consistency'] = True

    except Exception as e:
        validation_results['error'] = str(e)
        print(f"Error during validation: {str(e)}")

    return validation_results
9. Running the Playwright Test
Finally, we use Playwright to navigate to the web page, wait for the graph to render, and validate its accuracy.
async def test_line_graph():
    config = GraphValidationConfig(
        value_tolerance=0.01,
        trend_tolerance=0.02
    )

    validator = LineGraphValidator(config)

    async with async_playwright() as p:
        browser = await p.chromium.launch()
        page = await browser.new_page()

        await page.set_viewport_size({"width": 1200, "height": 800})

        await page.goto("https://your-graph-page.com")

        await page.wait_for_selector('canvas#lineGraph')

        results = await validator.validate_graph(
            page=page,
            api_url="dummy_url",
            point_selector="canvas#lineGraph",
            take_snapshot=True
        )

        print("Validation Results:")
        print(json.dumps(results, indent=2))

        assert results['data_integrity'], "Data integrity check failed"
        assert results['trend_accuracy'], "Trend accuracy check failed"
        assert results['value_accuracy'], "Value accuracy check failed"
        assert results['axes_validity'], "Axes validation failed"

        await browser.close()


if __name__ == "__main__":
    import asyncio

    asyncio.run(test_line_graph())
This Playwright automation script ensures that the line graph accurately represents API data by:
Conclusion
Automating the validation of line graphs ensures that data visualizations remain accurate and reliable. By comparing API data with extracted graph data, checking trend consistency, and verifying value accuracy, we can systematically test the correctness of visual representations. Our Playwright-based solution provides a flexible and scalable approach to validating Chart.js-powered graphs, making it easier to detect discrepancies and maintain data integrity in UI tests.
For those interested in running the validation themselves, the complete code example and a sample line graph application for testing will be available on our GitHub page. This will allow you to experiment with different configurations and adapt the solution to your specific testing needs.