Turn Your Playwright Traces Into Living Test Documentation

Your E2E tests are already documenting themselves. You're just not publishing the evidence. Every time Playwright runs, it captures pixel-perfect screenshots, network traffic, console logs, and timings for every user flow you've automated. Yet most teams let these traces rot in CI artifacts or local folders, treating them as debugging tools instead of what they really are: automatically generated, always up to date documentation that shows exactly how your application works. While your team debates whether to write manual test docs that'll be outdated by next sprint, your test suite has already recorded a visual walkthrough of every critical path in your app. The gap isn't tooling. It's realizing that documentation and test execution can be the same artifact.
The Problem With Traditional Test Documentation
Traditional test documentation dies the moment you write it. You spend an afternoon crafting a beautiful test plan with numbered steps, annotated screenshots, and expected results. Two sprints later, the UI has changed, three edge cases were added, and nobody updated the doc. Now it's worse than useless because it actively misleads new team members.
Manual screenshots are the worst offenders. That "Add to Cart" button moved from the top right to a sticky footer. The checkout flow now has an extra validation step. The success message uses different copy. Your documentation shows none of this, and updating 47 screenshots across 12 documents isn't anyone's idea of a productive Tuesday.
Written descriptions fare no better. "User clicks the blue submit button" becomes fiction when the button turns green during a rebrand. "System displays a confirmation modal" means nothing when the team switched to toast notifications. The code evolved, the documentation didn't, and the gap between them grows with every commit.
When deadlines hit, documentation maintenance is the first thing sacrificed. Developers are underwater shipping features. QA is scrambling to test them. Nobody has bandwidth to update a separate Word doc or Confluence page, especially when it feels like busywork compared to actually fixing bugs.
The cruel irony? New team members end up reading the test code itself to understand user flows. They parse through Playwright selectors and assertions, mentally reconstructing what the UI must look like, guessing at the happy path by reading expect statements backwards. It's slow, error-prone, and exactly what documentation is supposed to prevent.
How Trace Viewer Already Solves This (Almost)
Playwright's trace viewer already captures everything your manual documentation tries to accomplish. Every action gets a screenshot. Every network request is logged with full headers and payloads. Console errors, warnings, and debug messages are recorded. Precise timing data shows how long each step takes. It's a complete visual and technical record of exactly what happened during test execution.
Open any trace file and you get a frame-by-frame walkthrough of the user flow. Click through the timeline and watch the application state change at each step. See the actual UI, not a stale screenshot from three months ago. Inspect the network tab to understand what APIs were called. Check the console to spot warnings the user never sees.
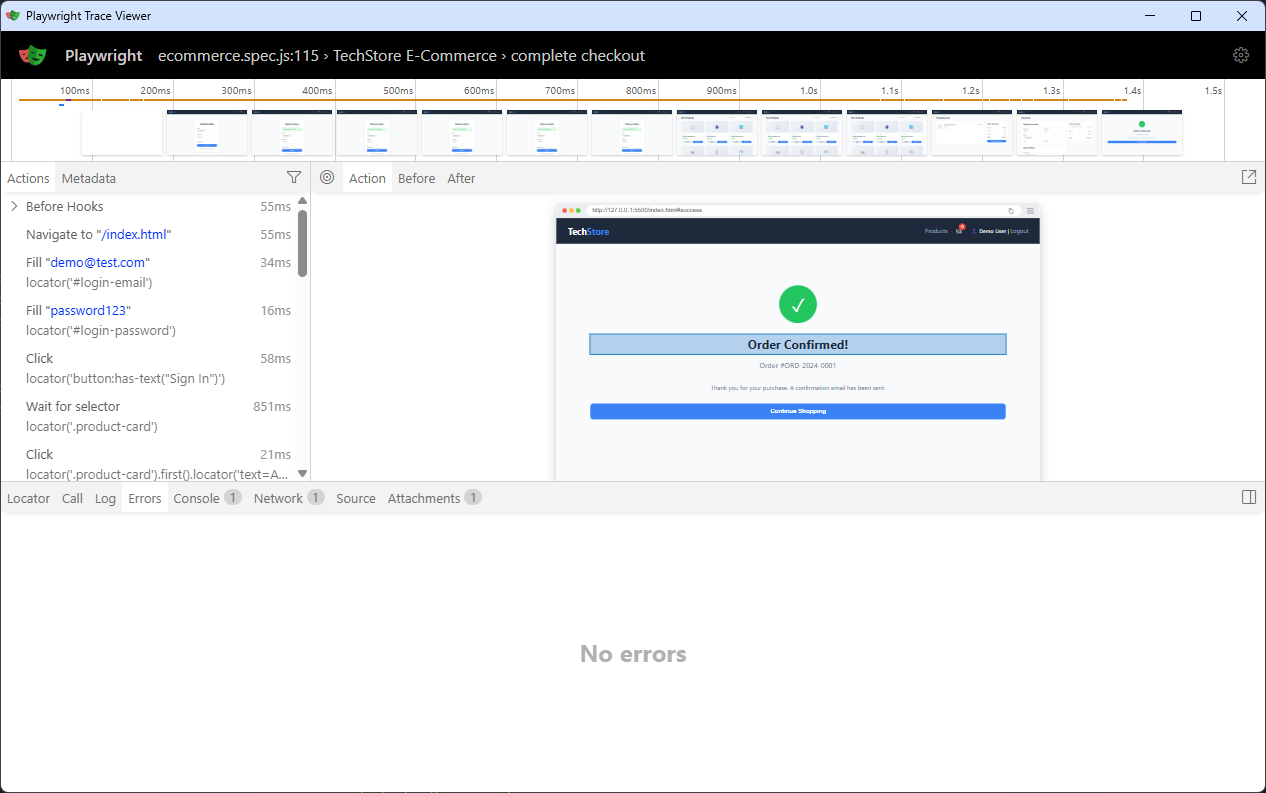
Trace Viewer Interface
The trace is always accurate because it's generated during test execution, not written by hand afterward. When your checkout flow changes, the next test run produces an updated trace automatically. No manual screenshot updates. No forgetting to document that new validation step. The trace reflects reality because it is reality.
There's just one problem: traces aren't packaged for human consumption. They sit in a test-results folder or get uploaded as CI artifacts that expire after 30 days. Your Product Manager doesn't know how to run npx playwright show-trace. Your new QA engineer doesn't know these traces exist. The documentation is there, it's just not published.
Configuring Traces for Documentation Mode
Most teams only generate traces on test failure, which makes sense for debugging but useless for documentation. You need traces from successful runs because those show the happy path workflows that stakeholders and new team members actually care about. Set trace: 'on' in your Playwright config to capture every run.
// playwright.config.js
use: {
  trace: 'on', // Always capture, not just 'on-first-retry'
}
Default trace output lands in a flat test-results directory with cryptic names like test-login-chromium-retry1. That's fine for debugging but terrible for browsing documentation. Organize by feature instead:
use: {
  trace: 'on',
  screenshot: 'on',
  video: "off", // keep traces lightweight
},
outputDir: './docs/traces',
Name your test files and descriptions with humans in mind. Instead of tc_001_login.spec.js, use user-authentication.spec.js. Add meaningful descriptions via test.info().annotations so the trace viewer shows "User completes checkout with saved payment method" instead of "test #3".
Traces can bloat quickly. A comprehensive E2E suite might generate gigabytes per run. Reduce screenshot quality to 50-75% for documentation purposes since you're showing workflow, not pixel-perfect design comps. Set up retention policies to keep only the latest successful trace per test. You don't need six versions of the login flow from the past week, you need one current reference.
use: {
  trace: 'on',
  screenshot: { mode: 'on', quality: 60 },
}
With these settings, you're generating documentation-ready traces without drowning in artifacts.
Building the Documentation Layer
Traces need an entry point. Running npx playwright show-trace trace.zip works for developers, but you need something stakeholders can click. The Playwright trace viewer is just static HTML and JavaScript. You can host it anywhere and point it at your trace files.
The simplest documentation layer is an index page that lists your traces with human-readable names. A basic Node script can scan your trace output directory and generate HTML links:
// generate-docs.js
const fs = require('fs');
const path = require('path');

const tracesDir = './docs/traces';
const tests = fs.readdirSync(tracesDir).map(dir => {
  const tracePath = path.join(tracesDir, dir, 'trace.zip');
  return {
    name: dir.replace(/-chromium$/, '').replace(/-/g, ' '),
    path: tracePath,
    modified: fs.statSync(tracePath).mtime
  };
});

const html = `


Test Documentation

  E2E Test Traces
  ${tests.map(t => `

      ${t.name}
      Last run: ${t.modified.toLocaleString()}

  `).join('')}

`;

fs.writeFileSync('./docs/index.html', html);
This gives you clickable documentation in seconds. Each link opens the trace viewer showing the full test execution with screenshots, network activity, and console logs.
Add metadata by pulling test descriptions from your spec files. Playwright's annotations already contain this information. You can parse them or extract metadata during test runs:
test("complete checkout", async ({ page }) => {
  test.info().annotations.push({
    type: "description",
    description: "User completes full checkout from login to confirmation"
  });
  // ... test code
});
For a visual quick reference, extract the first and last screenshot from each trace as thumbnails. This gives stakeholders an at-a-glance view of what each test covers without opening the full trace. The trace files are ZIP archives containing screenshots as individual files, making extraction straightforward.
The result is a documentation site that updates automatically every time your tests run. No manual maintenance required.
A Minimal Implementation
Let's build a documentation generator from scratch. We'll create a script that scans your trace folder, extracts metadata, and generates a clean HTML index page.
Step 1: Scanning for trace files
First, we need to find all the trace files in your output directory. Each test generates a folder with a trace.zip file inside:
// generate-docs.js
const fs = require('fs');
const path = require('path');

const TRACES_DIR = './docs/traces';

function getTraces() {
  if (!fs.existsSync(TRACES_DIR)) {
    console.log('No traces found. Run tests first.');
    return [];
  }

  const traces = [];
  const dirs = fs.readdirSync(TRACES_DIR);

  for (const dir of dirs) {
    const tracePath = path.join(TRACES_DIR, dir, 'trace.zip');
    if (fs.existsSync(tracePath)) {
      traces.push({ dir, tracePath });
    }
  }

  return traces;
}
Step 2: Extracting metadata
Now we enhance each trace entry with useful information. We'll clean up the folder names to be human-readable and grab file stats:
function getTraces() {
  // ... previous code ...

  for (const dir of dirs) {
    const tracePath = path.join(TRACES_DIR, dir, 'trace.zip');
    if (fs.existsSync(tracePath)) {
      const stats = fs.statSync(tracePath);
      traces.push({
        name: dir.replace(/-chromium$/, '').replace(/-/g, ' '),
        path: `traces/${dir}/trace.zip`,
        size: (stats.size / 1024).toFixed(0) + ' KB',
        modified: stats.mtime.toLocaleString()
      });
    }
  }

  return traces.sort((a, b) => a.name.localeCompare(b.name));
}
Step 3: Generating the HTML index
With our trace data collected, we generate a simple but styled HTML page. Each trace becomes a clickable card:
function generateHTML(traces) {
  return `	<!DOCTYPE html>
<html>
<head>
  <title>E2E Test Documentation</title>
  <style>
    body {
      font-family: system-ui;
      max-width: 1200px;
      margin: 40px auto;
      padding: 0 20px;
    }
    .trace-item {
      border: 1px solid #e2e8f0;
      padding: 20px;
      margin: 16px 0;
      border-radius: 8px;
    }
    .trace-item:hover {
      box-shadow: 0 4px 12px rgba(0,0,0,0.1);
    }
    .trace-name {
      font-size: 18px;
      font-weight: 600;
    }
    .trace-meta {
      color: #718096;
      font-size: 14px;
      margin-top: 8px;
    }
  </style>
</head>
<body>
  <h1>🎭 E2E Test Documentation</h1>
  <p>Generated: ${new Date().toLocaleString()}</p>
  ${traces.map(t => `
    <div class="trace-item">
      <div class="trace-name">
        <a href="trace.html?trace=${t.path}">${t.name}</a>
      </div>
      <div class="trace-meta">
        Last run: ${t.modified} • ${t.size}
      </div>
    </div>
  `).join('')}
</body>
</html>`;
}
Step 4: Writing the output
Finally, we tie it all together and write the HTML file:
const traces = getTraces();
const html = generateHTML(traces);

fs.writeFileSync('./docs/index.html', html);
console.log(`✅ Generated docs for ${traces.length} tests`);
Run this script after your tests complete:
npx playwright test
node generate-docs.js
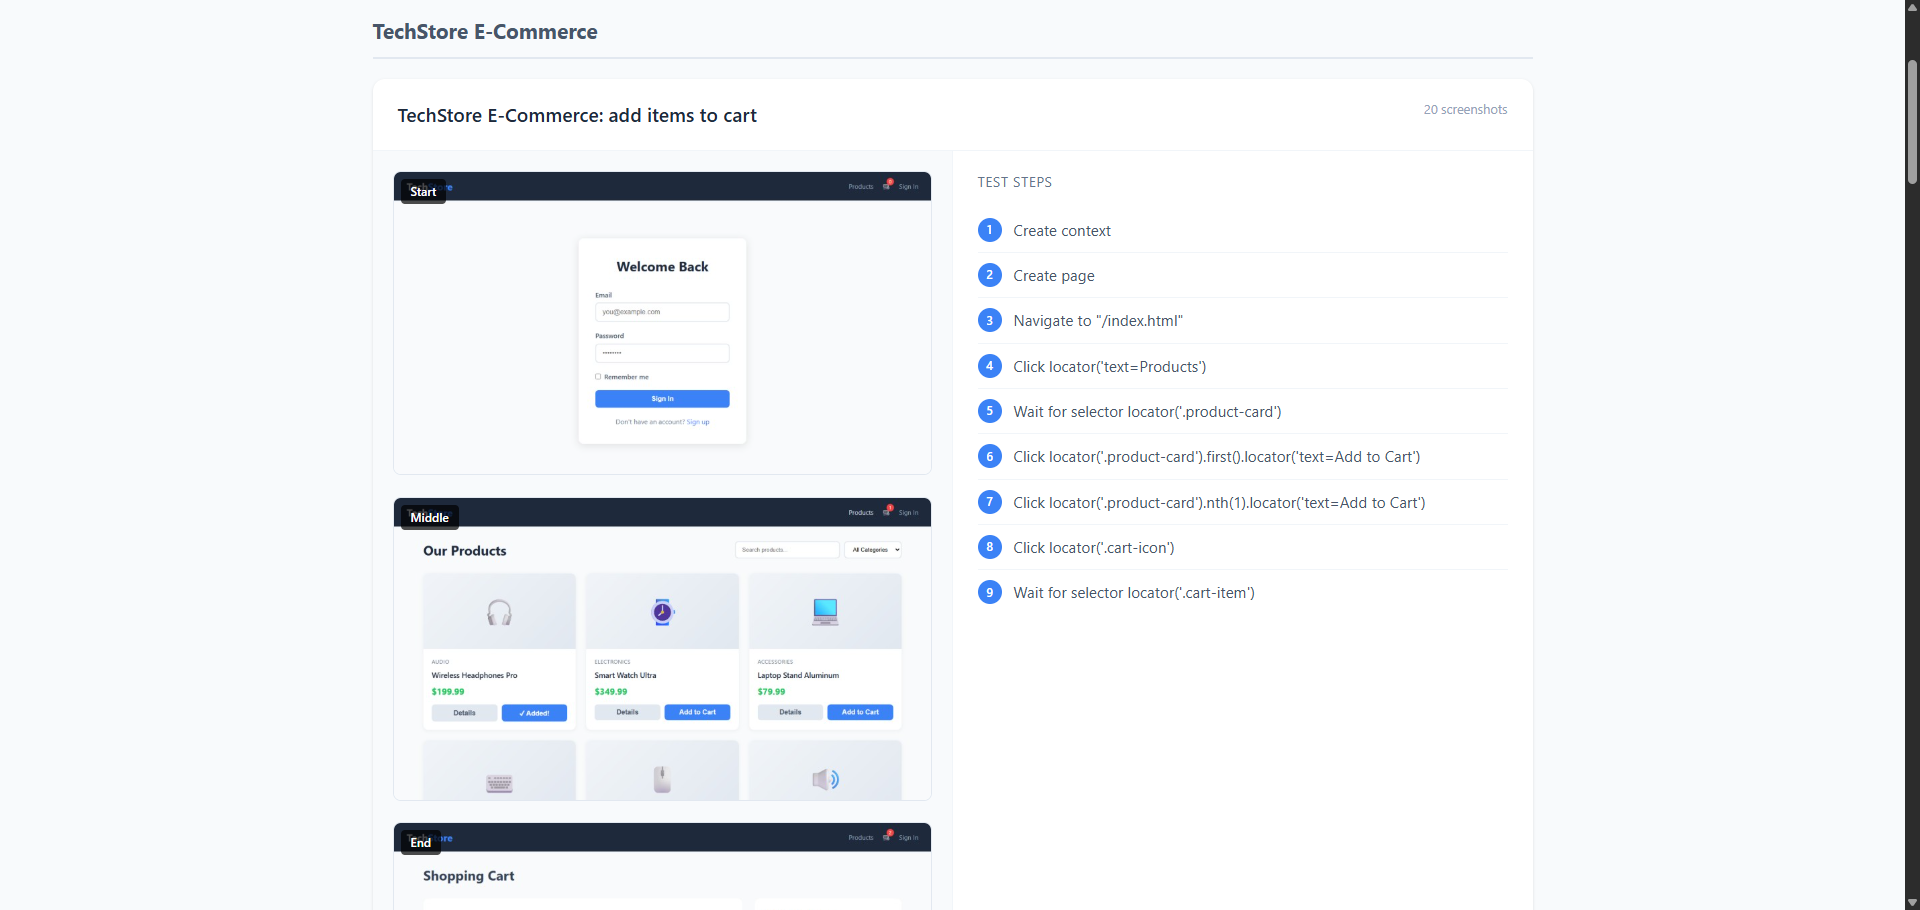
Trace Viewer Documenation Snippet
You now have a docs/index.html file that lists all your test traces. Open it in a browser, click any test name, and the Playwright trace viewer loads showing the full execution with screenshots, network calls, and console logs. No manual updates needed—regenerate after every test run and your documentation stays current.
Integrating With CI
Your documentation should update automatically with every test run. Configure your CI pipeline to run the documentation generator script after tests complete, regardless of whether tests pass or fail. This ensures your docs reflect the current state of your application.
Deploy the generated documentation somewhere accessible. GitHub Pages works well for open source projects and gives you a clean URL anyone can visit. For private codebases, upload to S3 with appropriate access controls, use Azure Blob Storage, or publish to your company's internal documentation platform. The goal is making traces browsable via a simple link that doesn't require repository access or local setup.
Storage costs add up fast if you keep every trace from every test run. Implement a retention policy that keeps only the most recent successful trace per test. Delete older versions during the documentation generation step. You don't need a week's worth of login flow traces when only the latest one matters for documentation purposes. This keeps your artifact storage lean while ensuring the docs always show current behavior.
Set up the workflow to run on every merge to your main branch. Some teams also generate docs on pull requests so reviewers can verify test coverage changes visually. The key is automation. Once configured, your test documentation updates itself without anyone remembering to run scripts or update screenshots manually.
When This Shines
Onboarding becomes self-service. New QA engineers or developers can browse your test documentation to understand how the application works without bothering senior team members. Instead of scheduling walkthrough meetings or reading outdated wiki pages, they click through traces to see actual user flows. They watch the checkout process happen step by step, see what validation errors look like, and understand the complete happy path in minutes instead of days.
Stakeholder demos get effortless. Product managers want to see the new feature but the staging environment is down. Designers want to verify the error state but don't have test credentials. Sales needs to show the workflow to a prospect. Just send them a link to the trace. No environment setup, no credentials needed, no "it works on my machine" excuses. They see exactly what the application does, with real data and real interactions.
Debugging conversations become precise. Instead of explaining "the button didn't work after I added items to the cart," you say "look at step 4 in the checkout trace." Everyone sees the exact screenshot, the network request that failed, and the console error that appeared. No more async Slack threads trying to reproduce issues. The trace is the shared source of truth.
Compliance and audit trails write themselves. In regulated industries, you need proof that specific workflows were tested and validated. Traces provide timestamped evidence of exactly what was tested, when it passed, and what the application state was at each step. Your QA documentation becomes an auditable artifact without any extra work. When auditors ask "how do you verify GDPR consent flows," you show them the trace with screenshots of every consent checkbox and network requests proving data wasn't sent prematurely.
The pattern is consistent: traces eliminate the need to recreate, explain, or manually document what your tests already captured automatically.
Conclusion
Your test suite is already generating comprehensive documentation every time it runs. The screenshots are current, the workflows are verified, and the technical details are captured automatically. All that's missing is publishing it.
Stop treating traces as throwaway debugging artifacts. With a simple script and a few CI configuration changes, you transform them into living documentation that stakeholders can browse, new team members can learn from, and auditors can verify. No more stale screenshots, no more drift between docs and reality, no more weekend documentation sprints before releases.
The complete code example, including the demo e-commerce site and all scripts shown in this post, is available on our GitHub page. Clone it, run the tests, and see trace-based documentation in action.
Where to take this next: Add search functionality so users can find specific flows quickly. Generate visual summaries by extracting key screenshots into a gallery view. Integrate with your test management system to link requirements to traces. Set up notifications when critical user flows fail so traces become both documentation and monitoring. Track trace file sizes over time to catch performance regressions in your tests themselves.
The foundation is simple. The possibilities expand from there. Your tests already know everything about your application. It's time to let them tell that story to everyone else.