Streamlining Test Reporting with Real-Time Dashboards

Test reporting plays a crucial role in automation testing by providing teams with valuable insights into the progress, quality, and effectiveness of their testing efforts. It serves as a vital communication tool, allowing stakeholders to track the status of tests, identify potential issues, and make informed decisions. However, traditional manual report-generation processes can be time-consuming and error-prone, hindering the agility and efficiency of testing teams. This is where the need for real-time reporting solutions arises, enabling testers to access up-to-date and actionable information instantly.
In this blog post, we will explore the significance of test reporting in automation testing, the challenges posed by manual report generation, and the benefits of adopting real-time reporting solutions. We will delve into a practical example that showcases how real-time dashboards streamline the reporting process, providing stakeholders with immediate visibility into the test execution results and facilitating faster decision-making. By embracing real-time reporting, testing teams can revolutionize their approach to reporting and elevate the effectiveness of their automation testing endeavors.
Understanding the Need for Real-Time Dashboards
Traditional test reporting approaches often come with limitations that can hinder the effectiveness of automation testing efforts. These limitations include delayed access to test results, static and outdated reports, and the need for manual compilation and distribution of reports. Such challenges can impede the progress of testing teams and hinder timely decision-making.
Real-time dashboards, on the other hand, offer a solution to these limitations by providing instant and dynamic access to test results. With real-time dashboards, testing teams can monitor the progress of test executions as they happen, gaining immediate visibility into the status of tests, test coverage, and defects. This level of real-time information empowers stakeholders to make faster and more informed decisions.
One of the key benefits of real-time reporting is improved visibility. Traditional reporting methods often result in static reports that may not capture the latest changes in the application being tested. Real-time dashboards overcome this limitation by displaying the most up-to-date information, allowing stakeholders to have a real-time pulse on the test execution progress. This visibility enables early detection of potential issues and facilitates proactive decision-making to mitigate risks.
Real-time reporting also contributes to faster decision-making. With immediate access to test results, stakeholders can quickly identify bottlenecks, assess the overall health of the application, and prioritize testing efforts accordingly. Real-time dashboards present data in a visually appealing and easily understandable format, allowing stakeholders to grasp the status and trends at a glance. This expedites decision-making processes, enabling teams to respond promptly to emerging issues and make adjustments in testing strategies as needed.
Furthermore, real-time dashboards foster enhanced collaboration among team members and stakeholders. By providing a centralized and accessible platform for sharing test results, everyone involved in the testing process can stay aligned and work collaboratively. Real-time reporting facilitates effective communication and enables stakeholders to discuss, analyze, and act upon the shared data, leading to improved coordination, efficiency, and, ultimately, better testing outcomes.
In conclusion, the need for real-time dashboards in automation testing arises from the limitations of traditional reporting approaches. Real-time reporting addresses these limitations by offering improved visibility, faster decision-making, and enhanced collaboration. By embracing real-time reporting solutions, testing teams can harness the power of immediate insights, ensuring more effective testing and delivering higher-quality software products.
Designing the Test Automation Framework
InfluxDB
As the backbone of our test automation framework, InfluxDB plays a crucial role in efficiently storing and querying time-stamped data. Its high-performance time-series database is perfectly suited for aggregating test results and metrics over time. InfluxDB's flexibility enables us to capture and store various real-time test data, including test execution status, response times, error rates, and more.
Selenium and Custom TestNG Listener
Our framework is primarily built using Selenium, a widely used automation tool for web testing. Additionally, we have developed a custom TestNG listener in Kotlin that acts as a data collector during test script execution. This custom listener gathers performance and test metrics, generating valuable insights throughout the test process.
Grafana
Grafana serves as the front-end visualization and monitoring tool for our real-time dashboard needs. It allows us to create interactive dashboards that display live test data from InfluxDB. Grafana's powerful querying capabilities enable us to create insightful charts, graphs, and visualizations, facilitating the monitoring of test execution progress and identification of patterns or issues.
How the Components Work Together
When we execute test scripts using Selenium and the custom TestNG listener, the listener collects various performance and test metrics during the test execution. These metrics are then sent in real-time to InfluxDB for efficient storage.
InfluxDB, with its powerful time-series database, efficiently stores the incoming data, enabling quick retrieval and analysis. Grafana interacts with InfluxDB to dynamically fetch the latest test results and metrics, displaying them on the real-time dashboard.
Benefits of the Automation Framework
Implementing Real-Time Data Capture
So how are we going to do this? We will write a piece of code that defines a custom test listener class that implements the ITestListener interface from TestNG, a popular testing framework for Java.
The test listener
A test listener is a mechanism provided by TestNG to listen to various test events and perform actions based on those events. In this specific implementation, the CustomTestListener class logs test results to a TestExecutionLogger.
We will start by declaring our logger:
class CustomTestListener : ITestListener {
    private var logger: TestExecutionLogger? = null
}
Next, we will need to override the following methods: onStart, onTestSuccess, onTestSuccess, and onFinish.
The onStart method is called when the test suite starts its execution. It initializes the logger object by creating an instance of the TestExecutionLogger class:
override fun onStart(context: ITestContext) {
    logger = TestExecutionLogger()
}
The onTestSuccess method is called when a test method passes successfully. It calls the logTestResult method to log the test result using the logger object:
override fun onTestSuccess(result: ITestResult) {
    logTestResult(result)
}
onTestFailure is called when a test method fails. It also calls the logTestResult method to log the test result using the logger object:
override fun onTestFailure(result: ITestResult) {
    logTestResult(result)
}
And the onFinish method is called when the entire test suite has finished its execution. It closes the logger if it is not null, ensuring that the logger's resources are released:
override fun onFinish(context: ITestContext) {
    if (logger != null) {
        logger!!.close()
    }
}
logTestResult is a private helper method that takes an ITestResult object, extracts relevant information about the test (such as test name, status, and execution time), and then logs this information using the logger object:
private fun logTestResult(result: ITestResult) {
    val testName = result.name
    val status = if (result.isSuccess) "passed" else "failed"
    val executionTime = result.endMillis - result.startMillis
    logger!!.logTestResult(testName, status, executionTime)
}
Logging the results
The next thing we are going to need is a utility class responsible for logging test results to an InfluxDB database:
class TestExecutionLogger {
    private val influxDBClient = InfluxDBClientFactory.create(
        "http://localhost:8086", //server url
        "your_access_token".toCharArray(), //access token
        "the_green_report", //InfluxDB org
        "tgr_automation" //InfluxDB bucket
    )
}
The influxDBClient is created using the InfluxDBClientFactory.create method, and it connects to the InfluxDB server running at http://localhost:8086. It uses an authorization token (access token) provided as a character array, which provides access to write data to the InfluxDB database.
Getting the access token is quite simple. Once you've installed and created your InfluxDB account, just navigate to the API Tokens menu and generate one.
The same holds for the organizations. An organization is a workspace for a group of users. All dashboards, tasks, buckets, members, etc., belong to an organization. You can create one by clicking the 'Create organization' button from the menu on the left.
And once you have an organization, you can select the buckets option from the menu on the left and create a new one. A bucket is a named location where time series data is stored. All buckets have a retention period, a duration of time that each data point persists. InfluxDB drops all points with timestamps older than the bucket's retention period.
Going back to our helper class, we are going to write a method that will log test results to InfluxDB. It takes three parameters:
The method creates a data point (measurement) with the test information and writes it to the InfluxDB database using the influxDBClient.writeApiBlocking property:
fun logTestResult(testName: String?, status: String?, executionTime: Long) {
    val writeApi: WriteApiBlocking = influxDBClient.writeApiBlocking
        val point = Point.measurement("test_metrics")
            .addTag("test_name", testName)
            .addTag("status", status)
            .addField("execution_time", executionTime)
            .time(System.currentTimeMillis(), WritePrecision.MS)
    writeApi.writePoint(point)
}
We also need a method to close the connection to the InfluxDB server:
fun close() {
    influxDBClient.close()
}
With this setup, test metrics such as test names, their statuses, and execution times will be stored in the tgr_automation bucket within InfluxDB, and we can use Grafana's querying and visualization capabilities to analyze and monitor the test results over time.
The actual test cases
The importance of the verification performed by our test cases is not relevant for this part. The crucial aspect is to utilize the listener we have developed for our test classes.
In TestNG we do this by utilizing their @Listeners annotation. It tells TestNG to use the custom class as a listener for the specific test class. TestNG listeners are used to customize the test execution behavior and gather information about test execution events. They can be used to perform actions before or after test methods execution, handle test failures, generate custom reports, and more.
To keep things short, here is an example test class that utilizes our CustomTestListener:
@Listeners(CustomTestListener::class)
class BaseTest {
    private var driver: WebDriver? = null
    private val baseUrl = "https://www.thegreenreport.blog/"
    private var logger: TestExecutionLogger? = null

    @BeforeClass
    fun setUp() {
        System.setProperty("webdriver.chrome.driver", "src/main/resources/chromedriver.exe")
        driver = ChromeDriver()
        (driver as ChromeDriver).manage().window().maximize()
        logger = TestExecutionLogger()
    }

    @Test
    fun testPageTitle() {
        driver!![baseUrl]
        val actualTitle = driver!!.title
        assertEquals(actualTitle, "The Green Report | Home", "Page title is not as expected.")
    }

    @AfterClass
    fun tearDown() {
        if (driver != null) {
            driver!!.quit()
        }
    }
}
For additional test cases, you can visit our GitHub repository.
Integrating InfluxDB and Grafana
At this point, if we execute our tests a couple of times, we will have our data of interest sent to InfluxDB and accessible inside our bucket:
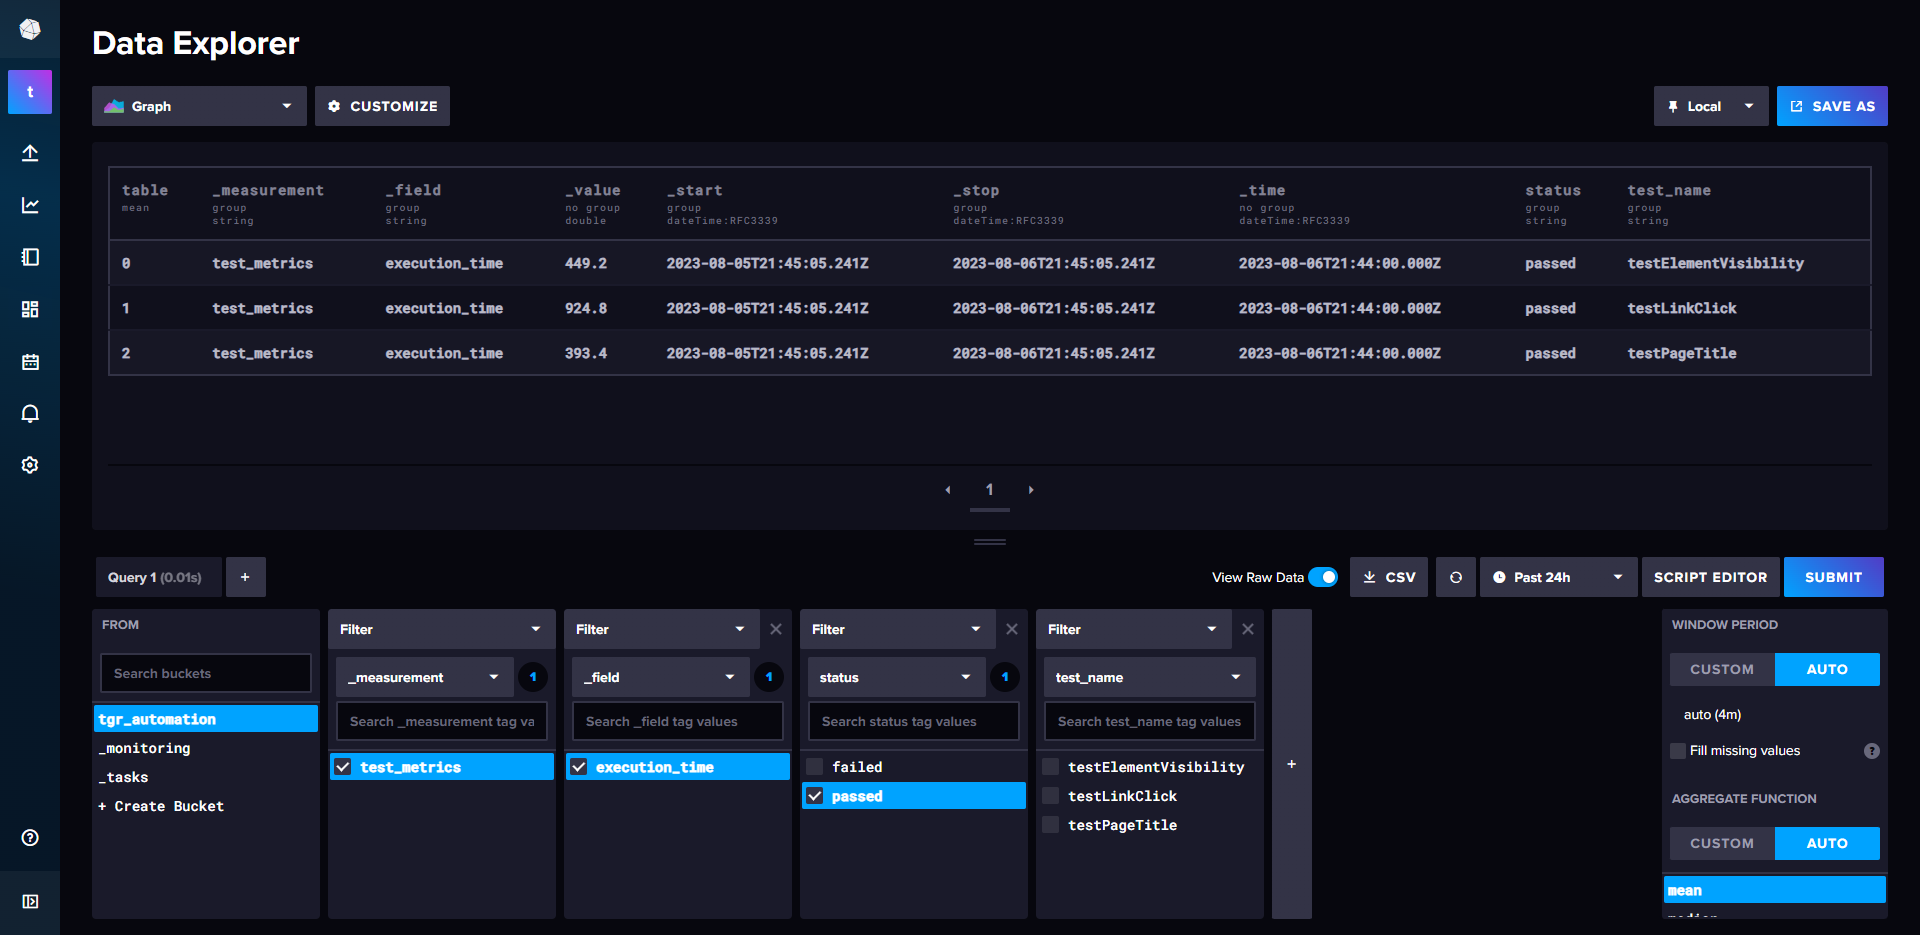
To utilize this data, we are going to create a connection with Grafana.
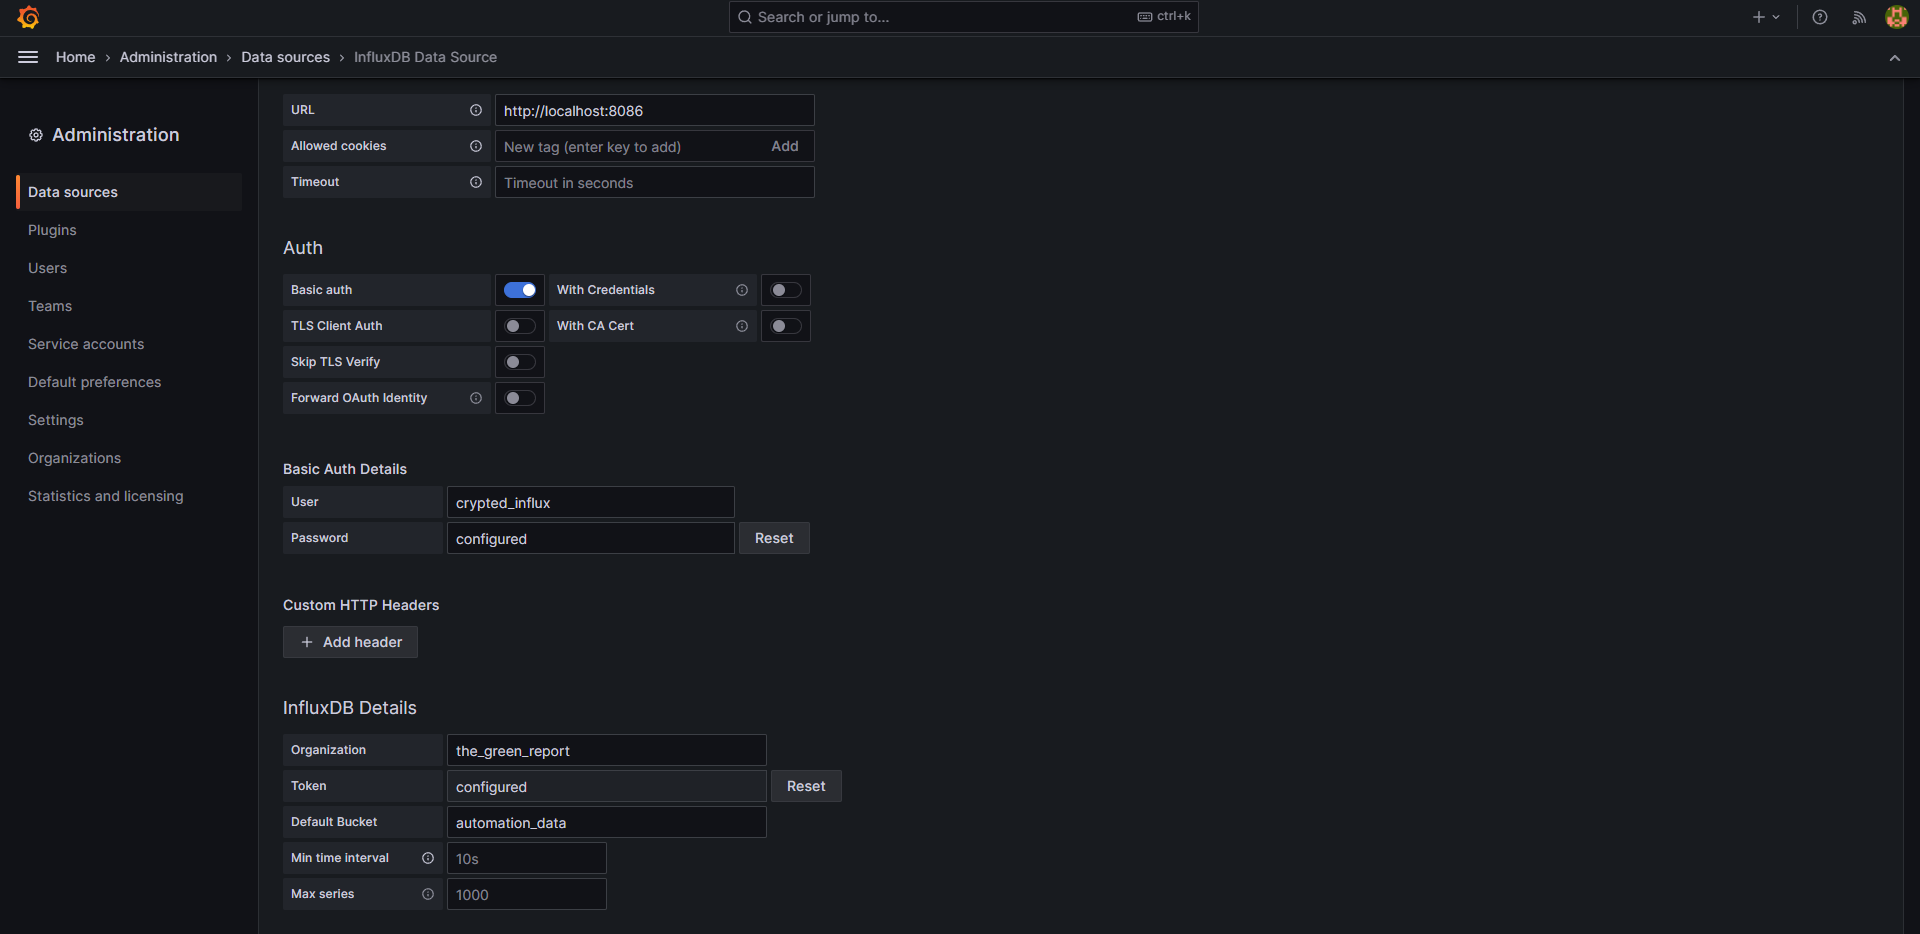
After installing and ensuring the server is operational, the next step involves creating a new data source for InfluxDB. This is a straightforward process accomplished through the GUI interface. It entails furnishing a name for the data source along with the necessary information for authentication with InfluxDB.
For our example, the data source information looks like this:
With the data source in place, we can start creating dashboards tailored to our specific testing needs. Grafana offers an intuitive and user-friendly GUI interface for building dashboards. A dashboard serves as a visual representation of your test execution metrics, providing insights into various performance parameters.
Now, the usual flow of creating dashboards in Grafana can be broken down into the following steps:
I want to take a second to talk about the configuration step. Grafana offers powerful options for querying the data from InfluxDB with the help of FLUX and InfluxQL.
Flux is InfluxData's functional data scripting language designed for querying, analyzing, and acting on data.
The language encompasses a plethora of features that are helpful for all types of queries. For instance, the subsequent query will retrieve the top 3 slowest passing tests from the past 24 hours:
from(bucket:"tgr_automation")
|> range(start: -1d)
|> filter(fn: (r) => r.status == "passed")
    |> group(columns: ["execution_time"])
    |> sort(desc: true)
    |> unique(column: "test_name")
    |> limit(n: 3)
    |> keep(columns: ["test_name", "_value"])
As seen from the example above, we can query everything from our data and visualize it in different ways. A small example dashboard might look like this:
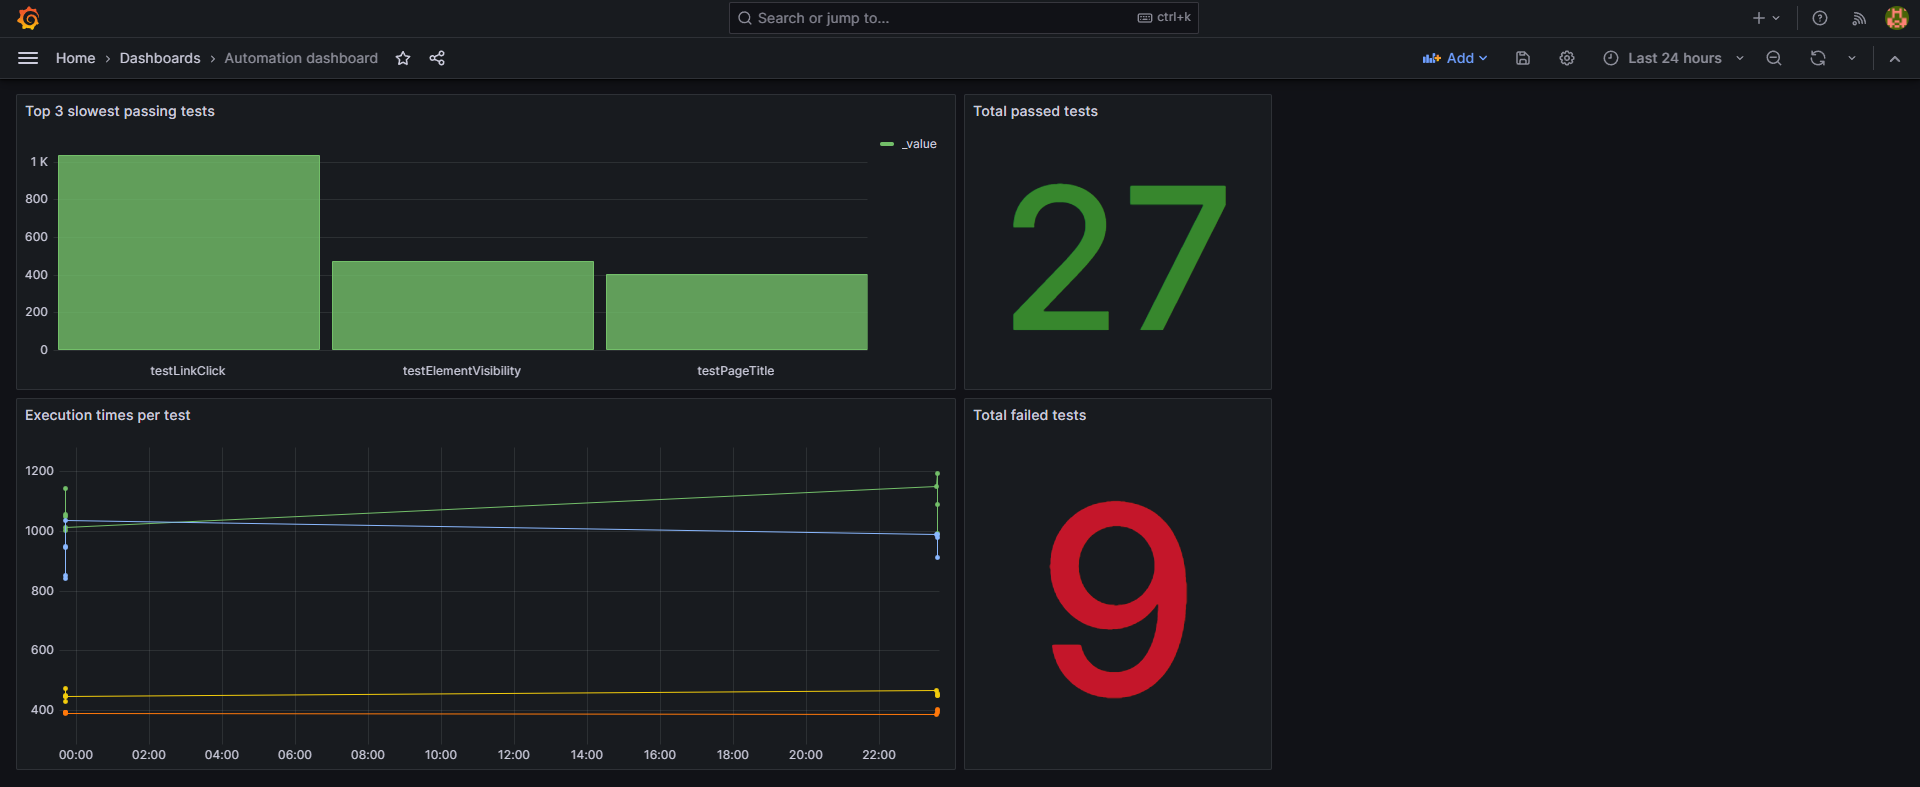
I will provide all FLUX queries for the panels on the screenshot on the GitHub page.
As you have observed, in our InfluxDB bucket, we employed only three parameters: the test name, its status, and its execution time. With just these three attributes, we can derive a variety of useful information that can be translated into panels and visualized on the dashboard. These include metrics such as:
Analyzing Real-Time Test Reports
Real-time test reports usher in a new era of proactive testing, allowing teams to meticulously monitor test executions and outcomes as they transpire. Through these real-time insights, testing teams gain the ability to swiftly detect anomalies, errors, and performance bottlenecks the moment they materialize during testing cycles. For example, consider a scenario where the real-time dashboard highlights the three slowest passing tests. This immediate feedback empowers teams to investigate these tests promptly, ensuring that the detected slowdowns are mitigated before they impede the software development process.
The value of real-time test reports extends to the acceleration of debugging and troubleshooting efforts. By having access to instant feedback on test failures or deviations, testing teams can methodically isolate the root causes of issues. This expedites the process of identifying problematic areas in the codebase, allowing developers to implement targeted fixes in a timely manner. Imagine a situation where the real-time dashboard registers a sudden surge in the count of failing tests. This direct insight prompts an immediate response, leading to a more focused and effective collaborative debugging process.
They also serve as dynamic command centers housing essential testing metrics and performance indicators. These dashboards empower teams to make informed decisions based on live data. For instance, if the count of passing tests experiences a consistent decline, the real-time dashboard offers a visual representation of this trend. This data-driven perspective enables teams to reevaluate their testing strategies, directing resources toward the areas that require attention, and thereby ensuring comprehensive test coverage.
Continuous monitoring of test progress and outcomes allows teams to dynamically redistribute resources to areas demanding immediate attention. If the execution times per test on the real-time dashboard reveal resource-intensive tests, teams can swiftly reallocate resources to optimize testing efficiency. This adaptive approach prevents resource bottlenecks and fosters a harmonious distribution of testing efforts.
The dynamic nature of real-time test reports provides an avenue for testing teams to refine and optimize their test execution strategies on the fly. Suppose the real-time dashboard exhibits a consistent pattern of prolonged execution times for certain tests. This insight prompts teams to reevaluate their approach, seeking ways to enhance the efficiency of these tests or allocate additional resources. The adaptability facilitated by real-time reports ensures that testing strategies remain agile and aligned with the evolving needs of the software.
Lets recap:
Real-time dashboards revolutionize test reporting by offering immediate insights into test execution statuses, enabling teams to swiftly react to issues and make informed decisions.
Test automation frameworks combined with InfluxDB and Grafana, empower teams to collect, visualize, and analyze test data seamlessly.
Custom loggers and data transformation techniques enhance the accuracy and relevance of test metrics, allowing for meaningful interpretations and informed quality improvements.
The latest FLUX query language provides a flexible and robust approach to querying and visualizing test data in Grafana, facilitating comprehensive insights into testing trends and performance.
By embracing these advancements in reporting, automation testing teams can elevate their efficiency, identify bottlenecks early, and continuously enhance their software quality assurance processes.
And as always, all code examples can be found on our GitHub page. Stay safe.