Frontend Performance Testing with Playwright and Lighthouse

The performance of our website's frontend plays a crucial role in user experience and search engine rankings. Slow load times and unresponsive interfaces can drive visitors away, impacting our site's engagement and conversion rates. To ensure our website performs optimally, automated tools like Lighthouse and Playwright can be invaluable.
Lighthouse, a powerful open-source tool from Google, audits web pages for performance, accessibility, SEO, and more. When combined with Playwright, a versatile browser automation library, we can create a robust performance testing setup to continuously monitor and enhance our site's frontend.
Why Frontend Performance Matters
Frontend performance directly impacts user experience and SEO. A slow or unresponsive website can frustrate users, leading to higher bounce rates and lower engagement. In contrast, a fast and smooth site keeps users satisfied, encouraging them to stay longer and interact more with our content. This user satisfaction translates into better conversion rates, whether we're driving sales, collecting leads, or simply increasing readership.
From an SEO perspective, search engines like Google prioritize websites that deliver excellent user experiences. Performance metrics are factored into search ranking algorithms, meaning a slow site can result in lower search engine rankings, reducing our site's visibility and organic traffic. Google's Core Web Vitals, a set of performance metrics, are particularly influential in this regard.
Understanding and improving frontend performance involves focusing on several key metrics:
These metrics are essential for understanding the performance of our frontend and identifying areas for improvement. By monitoring and optimizing these metrics, we can ensure that our website provides a fast, smooth, and enjoyable experience for users, which can lead to higher engagement, better SEO rankings, and improved overall success for our site.
Tools Overview
To effectively measure and optimize frontend performance, leveraging the right tools is essential. Two powerful tools for this purpose are Lighthouse and Playwright.
Lighthouse is an open-source, automated tool developed by Google that audits web pages for various performance aspects, including accessibility, SEO, and best practices. It provides detailed reports highlighting areas for improvement and offers actionable recommendations. Key capabilities of Lighthouse include:
Lighthouse can run as a Chrome DevTools extension, a command-line tool, or programmatically through Node.js, making it versatile for various use cases.
Playwright is a robust library for browser automation developed by Microsoft. It allows us to script browser interactions, automate testing, and perform end-to-end testing across multiple browsers like Chromium, Firefox, and WebKit. Key capabilities of Playwright include:
Combining Lighthouse and Playwright brings together the strengths of both tools, providing a comprehensive performance testing solution. Here's why this combination is beneficial:
By leveraging Lighthouse and Playwright together, we gain a powerful toolkit for automating and enhancing frontend performance testing. This integrated approach ensures that our website not only meets performance standards but also provides an optimal user experience across various browsers and devices.
Implementing the Performance Testing Tool
To begin automating our frontend performance testing with Lighthouse and Playwright, we'll need to install the necessary libraries. Use the following command to install Playwright, Lighthouse, and the playwright-lighthouse package:
npm install --save-dev playwright lighthouse playwright-lighthouse
This command will install Playwright and Lighthouse, allowing us to use them in our performance-testing scripts.
Writing the Script
First, we import the necessary modules for Playwright and Lighthouse integration.
import { test } from "@playwright/test";
import playwright from "playwright";
import { playAudit } from "playwright-lighthouse";
Then, we use Playwright's test function to define and run the audit.
test('Run Lighthouse audit on thegreenreport.blog', async ({ page }) => {
    const targetURL = 'https://www.thegreenreport.blog';
    const port = 9222; // Replace with your desired port if needed
Next, we will launch a headless Chromium browser with remote debugging enabled on the specified port.
const browser = await playwright.chromium.launch({
    args: [`--remote-debugging-port=${port}`],
});
After launching Chromium we create a new browser context and page, then navigate to the target URL.
page = await browser.newPage();
await page.goto(targetURL);
We can now use the playAudit function to run Lighthouse on the current page. This function requires the remote debugging port and thresholds for performance metrics.
await playAudit({
    page: page,
    port: port,
    thresholds: {
        performance: 85,
        accessibility: 85,
        'best-practices': 85,
        seo: 85,
    },
});
After the audit is completed, we just need to close the browser to free up resources.
    await browser.close();
});
Automating and Integrating with CI/CD
Once we've set up our performance testing tool with Playwright and Lighthouse, the next step is to automate these tests and integrate them into our CI/CD pipeline. This ensures that performance tests are run automatically with every code push, helping to maintain optimal performance and catch issues early.
Integrating our performance tests into a CI/CD pipeline using GitHub Actions is straightforward. Here's how we can set up a GitHub Actions workflow to run our performance tests on every push to the main branch.
The code starts by defining the name of the workflow using the name keyword. In this case, the workflow is named Frontend Performance Test. This name helps identify the purpose of the workflow.
name: Frontend Performance Test
The on keyword specifies when the workflow should be executed. Here, it's configured to run upon a push event (push). Further restricting the trigger, it only runs when there's a push to the main branch (branches: [main]). This means the workflow won't run for pushes to other branches.
on:
  push:
      branches: [main]
The jobs section defines the specific tasks the workflow will perform. Here, there's a single job named performance-test.
The runs-on keyword defines the runner environment where the job's steps will be executed. In this case, it's set to windows-latest, indicating the job will run on a virtual machine with the latest version of Windows.
jobs:
  performance-test:
    runs-on: windows-latest
The steps section defines a sequence of commands that the workflow will run. Each step has a name property that describes its purpose and a set of actions to be performed.
steps:
  - name: Checkout code
    uses: actions/checkout@v4

  - name: Set up Node.js
    uses: actions/setup-node@v4
    with:
      node-version: "20"

  - name: Install dependencies
    run: npm install

  - name: Install Playwright browsers
    run: npx playwright install

  - name: Run performance tests
    run: npx playwright test
With this configuration, our performance tests will be automatically executed as part of our CI/CD pipeline, ensuring that every code push is evaluated for frontend performance. This integration helps maintain a high performance standard and quickly identifies any performance regressions.
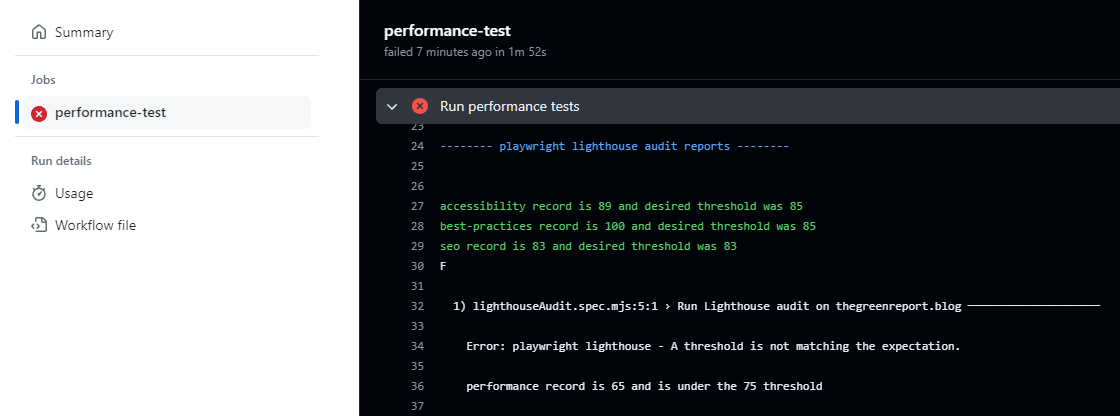
Example of a GitHub Actions log where the performance test failed
Reviewing and Optimizing Performance
Once our performance tests are automated and integrated into our CI/CD pipeline, it's essential to regularly review and optimize our application's performance based on the results. This section will guide you through analyzing the Lighthouse report, identifying performance bottlenecks, and establishing strategies for continuous improvement.
Tips for Identifying and Addressing Performance Bottlenecks:
Strategies for Continuous Performance Monitoring:
Continuous performance monitoring involves regularly running performance tests and analyzing the results to identify trends and areas for improvement. Here are some strategies:
Importance of Regularly Running Performance Tests as Part of the Development Workflow:
Regularly running performance tests as part of our development workflow ensures that performance is a continuous priority rather than an afterthought. This proactive approach helps:
By integrating continuous performance monitoring and regular testing into our development workflow, we create a culture of performance excellence, driving ongoing improvements and ensuring our application remains fast and responsive.
Conclusion
In this blog post, we've explored the crucial role of frontend performance in enhancing user experience and SEO. By leveraging automated testing tools like Lighthouse and Playwright, we can efficiently monitor and optimize our web applications to meet high-performance standards. Implementing these methods into our development workflow not only helps catch regressions early but also fosters a culture of continuous improvement.
You can view the complete code example and the GitHub Actions configuration in our repository.