From CI Failure to Root Cause in Seconds: MCP for QA Engineers

If you've spent any time in QA automation, you know the drill. The CI pipeline goes red, you open the dashboard, start reading through logs, cross-reference test history, check if it's flaky or a real regression, and 45 minutes later you finally have a theory about what broke. It's one of the most time-consuming parts of the job, and it happens every single day. In this post, I'll show you how to build an MCP server that gives an AI agent direct access to your CI data, so it can do that entire triage process in seconds and hand you a prioritized list of root causes with specific fixes.
What is MCP and Why Should QA Engineers Care?
MCP, or Model Context Protocol, is an open standard created by Anthropic that lets you connect AI models to external tools and data sources in a structured way. Think of it as a bridge between an AI agent and the systems you already use, whether that's your CI pipeline, your bug tracker, or your test reports.
Most QA engineers who have tried using AI for testing have done it the obvious way: copy a stack trace, paste it into ChatGPT, and ask what's wrong. That works sometimes, but it has a fundamental limitation. The AI is only seeing what you manually give it, one failure at a time, with no history, no pattern awareness, and no connection to your actual systems.
MCP changes that. Instead of you feeding information to the AI, the AI agent calls tools that fetch the information itself. It can look at your last 10 CI runs, pull the logs for every failing test, check whether a test has been flaky for weeks or just broke today, and correlate which tests tend to fail together. It builds the full picture on its own, the same way a senior engineer would, just in a few seconds instead of an hour.
For QA engineers specifically, this is significant. A lot of what makes triage slow is not that it's intellectually hard, it's that it's tedious and spread across multiple tools. MCP is particularly well suited to that kind of work.
The Problem We're Solving
Picture this. It's Monday morning, you open your CI dashboard, and three tests are red on the main branch. You click into the first failure and see a TimeoutError waiting for a selector that never appeared. You check the second one and it's an OAuth redirect landing on an error page instead of the dashboard. The third is a webhook signature verification failure. Three different errors, three different areas of the codebase, and no obvious connection between them.
So you start digging. You open the logs for the first failure, read through the stack trace, check the network requests, and notice the payment gateway returned a 504. You go back to the test history to see if this has happened before. It has, twice last week. You make a note. Then you move to the second failure and start the whole process again.
By the time you have a clear picture of what's actually going on, you've spent the better part of an hour context switching between your CI dashboard, your test history, your error logs, and whatever documentation is relevant to each failure. And the conclusion you eventually reach is that none of these are bugs in the application logic. They're environment and infrastructure issues that could have been identified in seconds if you had all the signals in one place.
That's exactly the problem this MCP server solves. Instead of you manually connecting those dots, an AI agent calls a set of tools that pull all the relevant data automatically, correlates the patterns, and hands you a prioritized list of what to fix and why. The triage that took an hour now takes the time it takes Claude to call five tools.
Architecture Overview
Before diving into the code, it helps to understand how the pieces fit together. The diagram below shows the full picture.
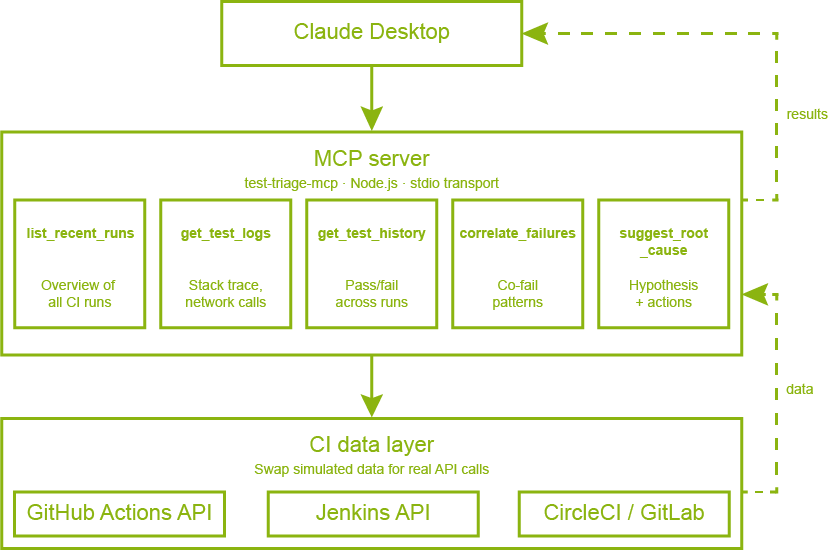
MCP architecture overview
At the center is the MCP server, a Node.js process that runs locally on your machine. It exposes five tools that Claude can call, each one responsible for fetching a specific type of data from your CI system. When you ask Claude to triage your test failures, it doesn't just think about the problem, it actively calls these tools in sequence, building up a complete picture of what's happening before it gives you an answer.
The five tools and their responsibilities are:
What makes this powerful is that the agent chains these tools automatically. You don't tell it which tools to call or in what order. You just ask it to triage your failures, and it figures out the right sequence on its own.
Building the MCP Server
Project Setup
The server is a Node.js project with two dependencies. The MCP SDK handles all the protocol communication with Claude, and Zod handles input validation for each tool.
{
  "name": "mcp-test-triage",
  "type": "module",
  "dependencies": {
    "@modelcontextprotocol/sdk": "^1.29.0",
    "zod": "^4.3.6"
  }
}
The server itself starts by importing three things: the McpServer class that represents our MCP server, the StdioServerTransport that handles communication with Claude Desktop over standard input/output, and z from Zod for schema validation.
import { McpServer } from "@modelcontextprotocol/sdk/server/mcp.js";
import { StdioServerTransport } from "@modelcontextprotocol/sdk/server/stdio.js";
import { z } from "zod";

const server = new McpServer({
  name: "test-triage-mcp",
  version: "1.0.0",
});
Registering a Tool
Every tool follows the same structure. You call server.registerTool() with a name, a config object containing the description and input schema, and an async handler function that does the actual work. The description is what Claude reads to decide when and how to use the tool, so it's worth being specific about what the tool returns and when to call it.
server.registerTool(
  "list_recent_runs",
  {
    description: "List recent CI/CD test runs with their status, branch, and failure summary. Use this as the starting point for any triage session.",
    inputSchema: {
      limit: z.number().min(1).max(20).default(5).describe("How many recent runs to return"),
      status: z.enum(["all", "failed", "passed"]).default("all").describe("Filter by run status"),
      branch: z.string().optional().describe("Filter by branch name (partial match)"),
    },
  },
  async ({ limit, status, branch }) => {
    // fetch and return runs
  }
);
Notice that each field in the inputSchema has a .describe() call. This is important because Claude reads these descriptions to understand what each parameter means and how to populate it correctly when calling the tool.
Detecting Flaky Tests vs Regressions
One of the most valuable things the server does is classify failures. The get_test_history tool looks at a test's pass/fail record across recent runs and determines whether it's genuinely broken or just intermittently failing. The logic is straightforward: if a test has both passes and failures in its history, it's flaky. If it only started failing recently after a period of passing, it's a regression.
const failCount = history.filter((h) => h.result === "FAIL").length;
const passCount = history.filter((h) => h.result === "PASS").length;

const isFlaky = failCount > 0 && passCount > 0;
const isRegression = failCount > 0 && history[0].result === "FAIL" && history[2]?.result === "PASS";

const classification = isFlaky
  ? "FLAKY"
  : isRegression
  ? "REGRESSION"
  : failCount === 0
  ? "STABLE"
  : "CONSISTENTLY_FAILING";
This classification feeds directly into the root cause suggestion, so the agent can give different recommendations depending on whether it's dealing with an environment problem or a genuine code change that broke something.
Synthesizing a Root Cause
The suggest_root_cause tool is where everything comes together. Rather than just returning raw data, it reads the signals from the logs and produces an actionable hypothesis. It checks for specific patterns in the error message and network requests, such as timeouts combined with 5xx responses, OAuth-related errors, or webhook signature failures, and maps each pattern to a confidence level and a set of recommended actions.
const hasTimeout = log.error.toLowerCase().includes("timeout");
const has5xx = log.networkRequests?.some((r) => r.status >= 500);
const hasAuthError = log.error.toLowerCase().includes("oauth");

if (hasTimeout && has5xx) {
  hypothesis = "External service dependency timeout — a downstream API is returning 5xx errors.";
  confidence = "HIGH";
  recommendedActions.push("Mock the external dependency in tests");
  recommendedActions.push("Add retry logic with exponential backoff in the app code");
}
The key design decision here is that the tool doesn't just describe the problem, it tells you what to do about it. That's what makes the agent's final output immediately actionable rather than just informative.
Starting the Server
Finally, the server connects to the stdio transport and starts listening. This is what allows Claude Desktop to spawn the process and communicate with it.
const transport = new StdioServerTransport();
await server.connect(transport);
Connecting it to Claude Desktop
Once the server is built, connecting it to Claude Desktop takes just a few steps.
Installing Dependencies and Testing the Server
Before touching any configuration, make sure the server runs without errors. Navigate to your project folder and run the following commands.
npm install
node server.js
If everything is working, you should see this in your terminal:
✅ test-triage-mcp server running on stdio
You can stop it with Ctrl+C. Claude Desktop will handle starting and stopping the process automatically once it's configured.
Finding the Config File
Claude Desktop reads its MCP server configuration from a JSON file stored in a different location depending on your operating system.
On macOS:
~/Library/Application Support/Claude/claude_desktop_config.json
On Windows:
%APPDATA%\Claude\claude_desktop_config.json
On Linux:
~/.config/Claude/claude_desktop_config.json
If the file doesn't exist yet, create it. If it already exists and has other settings in it, you'll be adding to it rather than replacing it.
You can also head to Settings > Developer in Claude Desktop and click Edit Config; this will take you straight to the config file.
Adding the MCP Server
Open the config file and add an mcpServers block. The command tells Claude Desktop which program to use to start the server, and args is the path to your server.js file. Make sure to use the absolute path so Claude Desktop can find it regardless of where it's launched from.
{
  "mcpServers": {
    "test-triage": {
      "command": "node",
      "args": ["/absolute/path/to/server.js"]
    }
  }
}
On Windows, use double backslashes in the path:
{
  "mcpServers": {
    "test-triage": {
      "command": "node",
      "args": ["C:\\Users\\YourUsername\\projects\\mcp-test-triage\\server.js"]
    }
  }
}
Verifying the Connection
Fully quit Claude Desktop and reopen it. This step is important because Claude Desktop only reads the config file on startup. Once it's running again, start a new conversation and ask something like:
Load the test triage tools and list the available ones.
You should see Claude respond by listing all five tools. If it does, the server is connected and ready to use.
Seeing it in Action
With the server connected, let's walk through what an actual triage session looks like. In a new Claude Desktop conversation, ask it the following:
We have failing tests on main. Run the test triage tools, identify the root causes, and tell me what to fix first.
You'll notice that Claude doesn't ask any clarifying questions. It immediately starts calling tools in sequence, and you can watch each step happen in real time.
Step 1: Getting the OverviewThe first thing the agent does is call list_recent_runs to understand the landscape. It's not looking at individual failures yet, it's building a mental model of which branches are affected, how many runs have failed, and what the overall failure rate looks like. This is the same thing a senior engineer would do: get the big picture before diving into details.
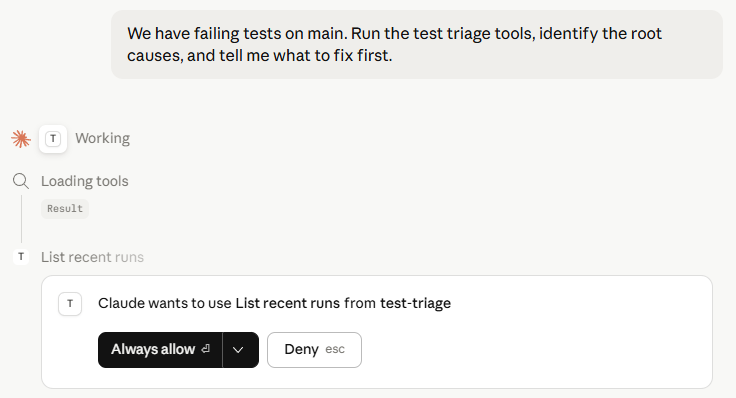
list_recent_runs call in Claude Desktop
Step 2: Finding the PatternsNext, the agent calls correlate_failures. Before it even looks at individual logs, it wants to know which tests are failing together and how frequently. This is where it starts forming hypotheses. If two auth tests are consistently co-failing, that's a stronger signal than if they're failing independently.
Step 3: Drilling Into the LogsArmed with the correlation data, the agent calls get_test_logs and get_test_history for each of the top failing tests. It's looking for two things: what the error actually says, and whether this is a new problem or something that has been happening for a while. A test that failed once is treated very differently from one that has been intermittently failing for two weeks.
Step 4: The OutputAfter chaining all five tools automatically, Claude produces a response that looks like this:
🔴 Root Causes — Prioritized Fix Order1. checkout.spec.ts::completeOrder — Fix First
Failing 3 out of 4 runs on main. The payment gateway is returning
5xx/504 errors in CI, so the order confirmation page never loads.
What to fix:
- Mock the external payment API in tests
- Add retry logic with exponential backoff for the payment gateway call
- Assert on the error state rather than waiting 30s for a selector
that will never appear
2. auth.spec.ts::loginWithOAuth — Fix Second
Failing on both main and hotfix/auth, co-failing with refreshToken,
suggesting a shared OAuth state problem.
What to fix:
- Clear cookies and localStorage in beforeEach
- Check if parallel test runs are sharing a single OAuth app
3. payment.spec.ts::stripeWebhook — Fix Third
Only failing on feature/payment-v2. High confidence root cause:
STRIPE_WEBHOOK_SECRET in CI does not match the test dashboard secret.
What to fix:
- Sync STRIPE_WEBHOOK_SECRET in your CI environment variables
- Use stripe-mock locally so you are never dependent on the real
Stripe signing secret in CI What Just Happened
That output took Claude roughly 10 seconds to produce. It called five tools, read through multiple run logs and test histories, identified that all three failures are infrastructure and environment issues rather than bugs in application logic, and handed you a prioritized fix list with specific actions for each one.
The same triage done manually, opening the CI dashboard, reading through each log, cross-referencing test history, and connecting the patterns across failures, typically takes between 30 minutes and an hour depending on how familiar you are with the codebase. That's the difference this kind of tooling makes in practice, not just on paper.
Adapting it to Your Real CI
The server we built uses simulated data to keep the focus on the MCP concepts rather than CI API authentication. Replacing that simulated data with real CI data is straightforward, and the MCP tool structure stays completely unchanged. The only thing that changes is what happens inside each handler function.
Connecting to GitHub Actions
GitHub Actions exposes a REST API that returns exactly the kind of data our tools expect. To fetch real runs, replace the TEST_RUNS constant with an API call. You'll need a personal access token with repo scope, which you can generate from your GitHub settings.
The list_recent_runs handler becomes a real API call like this:
async ({ limit, status, branch }) => {
  const response = await fetch(
    `https://api.github.com/repos/{owner}/{repo}/actions/runs?per_page=${limit}`,
    {
      headers: {
        Authorization: `Bearer ${process.env.GITHUB_TOKEN}`,
        Accept: "application/vnd.github+json",
      },
    }
  );

  const data = await response.json();
  const runs = data.workflow_runs.map((run) => ({
    id: run.id,
    branch: run.head_branch,
    commit: run.head_sha.slice(0, 7),
    status: run.conclusion,
    startedAt: run.created_at,
  }));

  return {
    content: [{ type: "text", text: JSON.stringify({ runs }, null, 2) }],
  };
}
Store your token in an environment variable rather than hardcoding it. You can pass environment variables to the MCP server through the Claude Desktop config file:
{
  "mcpServers": {
    "test-triage": {
      "command": "node",
      "args": ["/absolute/path/to/server.js"],
      "env": {
        "GITHUB_TOKEN": "your_token_here"
      }
    }
  }
}
Connecting to Jenkins
If you're running Jenkins, the approach is the same but the API shape is different. Jenkins exposes its build data through a JSON API that you can access by appending /api/json to any build or job URL.
const response = await fetch(
  `${process.env.JENKINS_URL}/job/{job-name}/api/json?tree=builds[number,result,timestamp,duration]`,
  {
    headers: {
      Authorization: `Basic ${Buffer.from(
        `${process.env.JENKINS_USER}:${process.env.JENKINS_TOKEN}`
      ).toString("base64")}`,
    },
  }
);
Fetching Real Test Logs
For the get_test_logs tool, the most useful source of data is usually your test reporter output rather than the raw CI log. If you're using Playwright, for example, you can configure it to output a JSON report and store it as a CI artifact. Your tool can then fetch that artifact directly and parse it into the structured format the agent expects.
// Fetch Playwright JSON report stored as a GitHub Actions artifact
const artifactResponse = await fetch(
  `https://api.github.com/repos/{owner}/{repo}/actions/runs/${runId}/artifacts`,
  { headers: { Authorization: `Bearer ${process.env.GITHUB_TOKEN}` } }
);

const { artifacts } = await artifactResponse.json();
const report = artifacts.find((a) => a.name === "playwright-report");
What Stays the Same
Regardless of which CI system you connect to, three things never change. The tool names and descriptions stay the same because Claude has already learned how to use them. The input and output schemas stay the same because the agent expects the same data shape. And the suggest_root_cause logic stays the same because the signal detection, looking for timeouts, 5xx errors, auth failures, is based on patterns in log content rather than anything CI-specific.
This is one of the real benefits of the MCP architecture. The intelligence layer is completely decoupled from the data layer. You can swap out GitHub Actions for Jenkins, CircleCI, or GitLab without touching anything the agent interacts with.
What's Next
The server we built covers the core triage loop, but it's really just a starting point. Once you have an MCP server sitting between Claude and your CI data, there are a lot of directions you can take it.
Automatic Bug Report CreationRight now the agent tells you what's wrong and what to fix. The natural next step is to have it act on that information. You could add a create_bug_report tool that takes the root cause output and automatically opens a Jira ticket or GitHub issue with the failure details, stack trace, affected runs, and recommended actions already filled in. A bug report that used to take 10 minutes to write properly gets created in the same session as the triage.
Slack NotificationsInstead of waiting for someone to manually run a triage session, you could trigger the agent automatically when a CI run fails and have it post the results directly to a Slack channel. A send_slack_notification tool combined with a webhook from your CI system means your team gets a prioritized root cause summary in Slack before anyone has even opened the dashboard.
Connecting to Your Test ReporterThe simulated data in this server uses a simple structure, but real test reporters like Playwright, Cypress, and Jest produce rich JSON output with timing data, retry counts, screenshot paths, and video recordings. Adding a get_playwright_report tool that parses this output would give the agent significantly more signal to work with, particularly for detecting flakiness patterns that only show up across multiple retry attempts within a single run.
Cross-Run Trend AnalysisThe current correlate_failures tool looks at a fixed window of recent runs. A more powerful version would track failure trends over time, identifying tests whose failure rate is slowly increasing, or failures that only appear on certain days of the week, which often points to scheduled jobs or external services with usage patterns. This kind of trend data is hard to spot manually but straightforward to surface with the right tool.
Conclusion
What we built in this post is more than a debugging tool. It's a demonstration of what becomes possible when you give an AI agent structured access to the systems QA engineers work with every day.
The key insight from the triage session is worth repeating: all three failures were infrastructure and environment issues, not bugs in application logic. That conclusion sounds obvious once someone tells you, but it's the kind of thing that gets missed or takes a long time to confirm when you're manually reading through logs one failure at a time. The agent reached it in seconds because it could see all the signals at once, the error types, the network requests, the test history, the co-failing patterns, and reason across all of them together.
That's what MCP enables. Not AI that guesses at your problems based on a stack trace you paste into a chat window, but AI that actively investigates, pulls the data it needs, and builds a complete picture before drawing any conclusions. For QA engineers, that distinction matters enormously because the value of triage isn't just knowing what failed, it's knowing why, how long it's been happening, what else is affected, and what to do about it.
The full source code for the MCP server is available on our GitHub. Clone it, run it, break it, and make it your own. The best way to understand what MCP servers can do for your QA workflow is to start experimenting with them firsthand. out.