Boosting API Test Efficiency with Playwright's Request Interception

Automated testing frameworks like Playwright provide powerful tools to streamline the testing process, but logging and managing API responses can often be overlooked. In this post, we'll explore how to implement a structured approach to API response verification in Playwright, focusing on effectively logging failed requests. By setting up robust error handling and detailed logging mechanisms, we can gain valuable insights into our API's behavior and enhance the reliability of our testing suite.
Understanding API Request Tracking
Tracking API requests and their responses is essential for effective debugging and ensuring the reliability of our application. In Playwright, we can easily monitor network activity by listening for specific events related to requests and responses. This allows us to capture any failed requests and log relevant details, providing valuable insights into the behavior of our APIs during automated tests.
To track API requests and responses in Playwright, we can utilize the page.on() method to set up listeners for requestfailed and response events. Here's a breakdown of how this works:
1. Listening for Failed Requests: When a request fails due to network issues or server errors, the requestfailed event is triggered. We can attach a listener to this event to capture the request object and store it for later analysis.
page.on("requestfailed", (request) => {
  failedRequests.push(request);
});
2. Capturing Responses: In addition to tracking failed requests, it's important to monitor responses, especially those with HTTP status codes indicating errors (4xx and 5xx). By listening to the response event, we can inspect the response status and push the corresponding request to our failedRequests array if it indicates an error.
page.on("response", (response) => {
  const status = response.status();
  if (status >= 400 && status < 600) {
    failedRequests.push(response.request());
  }
});
3. Storing Failed Requests: We use an array, such as failedRequests, to store the requests that failed or received error responses. This allows us to analyze them later in our test cases, providing crucial information about what went wrong during the test execution.
4. Logging Failed Requests: After running our tests, we can log the details of any failed requests. This can be done in a centralized logging function that iterates through the failedRequests array, printing useful information such as the request URL, method, and response status.
By implementing this request tracking strategy in our Playwright tests, we can ensure that we capture and log all relevant network activity, making it easier to diagnose issues and improve the overall reliability of our applications. This structured approach not only enhances our testing process but also provides a clearer understanding of our API's performance under various conditions.
Implementing Request and Response Logging
Now that we have covered how to track API requests and responses, let's explore how to log this information effectively. By capturing key details of failed network requests and responses, we can make debugging easier and ensure that issues are properly documented.
1. Define a Logging Function
The core of our logging implementation is a helper function that processes the captured failed requests. This function will log important details, such as the request URL, method, and status code.
async function logFailedRequests(failedRequests, step) {
  if (failedRequests.length === 0) {
    console.log(`\nNo failed network requests for: ${step}`);
    return;
  }

  console.log(`\nFailed network requests for: ${step}`);
  await Promise.all(
    failedRequests.map(async (request, index) => {
      const response = await request.response();
      console.log(`\nRequest #${index + 1}`);
      console.log(`URL: ${request.url()}`);
      console.log(`Method: ${request.method()}`);
      console.log(`Status: ${response ? response.status() : "No response"}`);
      if (response) {
        console.log(`Response status text: ${response.statusText()}`);
      }
    })
  );
}
This function accepts two arguments:
It first checks if there are any failed requests to log and, if so, prints the details of each request and its corresponding response (if available).
2. Hook the Logging to Our Test Workflow
To ensure that failed requests are logged after every test, we use Playwright's afterEach hook. This hook will invoke the logging function with the test name and failed requests as input.
test.afterEach(async ({ page }) => {
  await logFailedRequests(failedRequests, `${test.info().title}`);
  failedRequests = [];
});
This guarantees that any network failures are captured and logged after each test case runs, making it easier to pinpoint issues.
3. Running Tests with Logging
Once we've set up the tracking and logging, we can run our tests without having to duplicate the logic for request handling. Here's an example of a test that verifies data on the UI, ensuring it matches the combined results from two API responses. The test also logs any errors encountered.
test("verify first two API responses", async ({ page }) => {
  const successMessage = "Data from API";
  const apiLogPage = new ApiLogPage(page);

  setupRequestTracking(page);

  await apiLogPage.goto();
  await apiLogPage.setResponseCodes({
    firstResponseCode: "200",
    secondResponseCode: "200",
    thirdResponseCode: "200",
  });

  await apiLogPage.fetchFirstAndSecondApi();

  await apiLogPage.verifyFirstTwoApiResponses(successMessage, successMessage);
});
This way, we benefit from the request tracking mechanism discussed in the previous section without needing to repeat the setup. The event listeners for requestfailed and response are established once, and the logging mechanism is cleanly triggered only when needed.
Example App for Testing Scenarios
In our tests, we use a sample application that simulates API responses based on predefined response codes. This app allows us to control the behavior of the APIs, enabling us to test various scenarios like successful responses, client errors, and server errors. By setting specific response codes for each API call, we can easily verify how the application under test handles different situations.
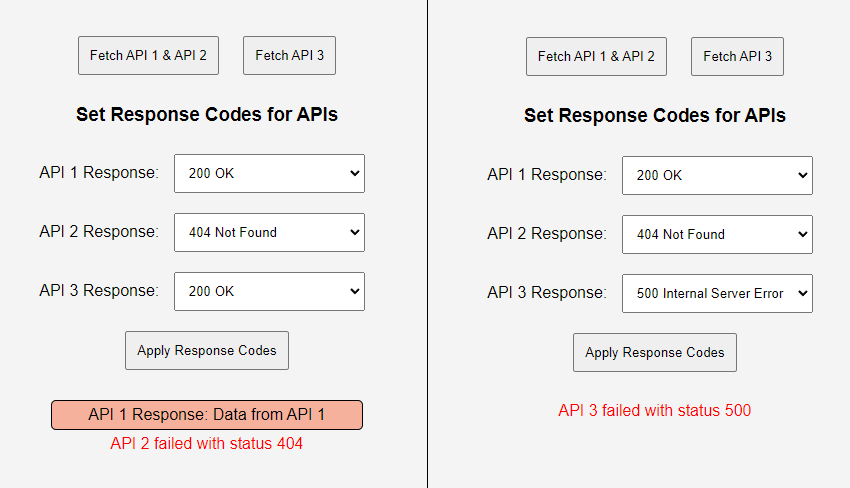
Custom app for testing API responses
The method setResponseCodes plays a key role in controlling our test flows. It allows us to specify what response each API should return during the test. For example, we can configure API 1 and API 2 to return success (200) status codes while setting API 3 to return a server error (500). This flexibility is crucial in automating the verification of various API responses.
Here's an example of how we set the response codes in our test setup:
await apiLogPage.setResponseCodes({
  firstResponseCode: "200",  // API 1 returns a success
  secondResponseCode: "200", // API 2 returns a success
  thirdResponseCode: "500",  // API 3 simulates a server error
});
By using setResponseCodes, we can dynamically configure how the APIs respond during the test. This makes the testing process both flexible and controlled, allowing us to test specific scenarios and ensure that the system handles different API responses correctly.
Analyzing Test Results and Logging Outputs
Once our API verification tests are complete, it's important to analyze the test results and understand the logged outputs. Proper logging not only helps in debugging issues but also provides insights into the behavior of the system under various conditions. Let's look at how to effectively read and interpret these logs.
Understanding the Log Structure
The log output from the logFailedRequests function provides key details about any failed API requests encountered during the test. Each log entry includes the following information:
Here's an example of a log entry for failed requests:
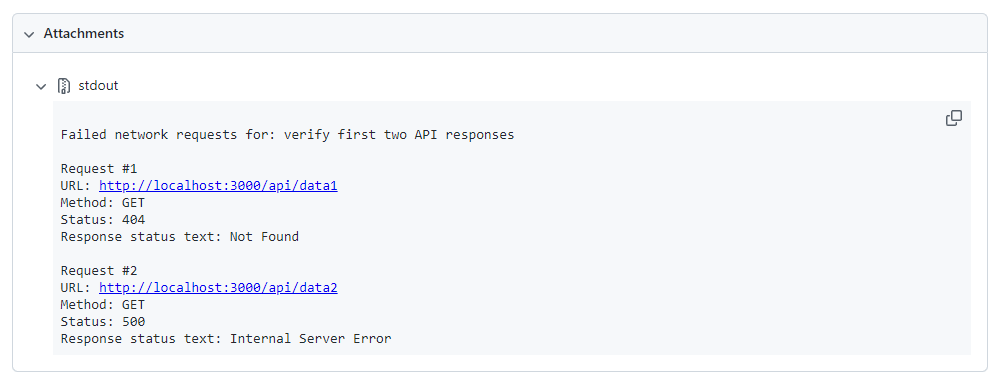
Log entry for failed requests
This log indicates that a request to http://localhost:3000/api/data1 using the GET method returned a 404 error, meaning the requested resource could not be found on the server. Additionally, a request to http://localhost:3000/api/data2 using the GET method returned a 500 error, indicating that the server encountered an internal issue while trying to process the request.
And here's an example of a log entry for successful requests:
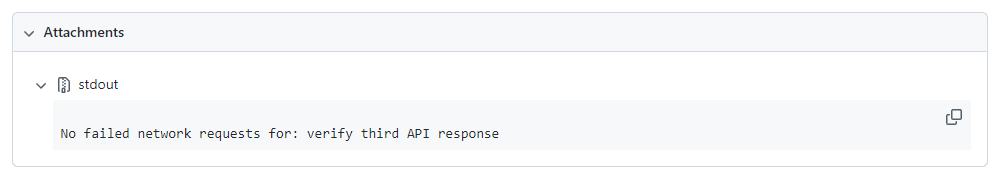
Log entry for successful requests
How to Interpret the Logs
By analyzing these logs, we can quickly identify which APIs failed, why they failed, and how to proceed with debugging.
Debugging Strategies
By thoroughly reviewing the logs and following these debugging strategies, we can effectively resolve issues encountered during API testing and improve the reliability of our automated tests.
Conclusion
Effective API request tracking and response verification in Playwright can significantly improve debugging and test reliability. By implementing request logging, handling errors, and structuring test cases efficiently, we can ensure that our API interactions are thoroughly tested and any issues are easily identified through clear logs. This approach enhances the overall robustness of our automated test suite.
For complete code examples and the testing app used in this post, visit our GitHub page. There, you'll find all the resources to implement and run the tests yourself, along with additional information to help you get started.