7 Chrome DevTools Features for Smarter Debugging

In this post, we'll explore seven powerful yet often overlooked features in Chrome DevTools that can significantly improve debugging workflows for QA engineers. These tools go beyond basic inspection and provide deeper insights into how applications perform, respond to network conditions, and handle accessibility. Whether we're troubleshooting complex issues or fine-tuning application behavior, these DevTools features can streamline our process and help us catch critical issues early. Let's dive in and see how each of these can help elevate our QA testing toolkit.
1. Content Override
The Content Override feature in Chrome DevTools allows us to modify responses from the server without needing any backend updates. This is especially useful when testing new features or bug fixes where backend support isn't yet available or when mocking edge cases for testing purposes. By overriding network responses, we can validate UI behavior, error handling, and more - directly in the browser.
Why It's Great:
How to Use Content Override:
1. Open the Network Tab: In Chrome DevTools, go to the "Network" tab and reload the page to capture requests.
2. Find the Request: Locate the network request you want to modify.
3. Override Content: Right-click on the request and select 'Override content'
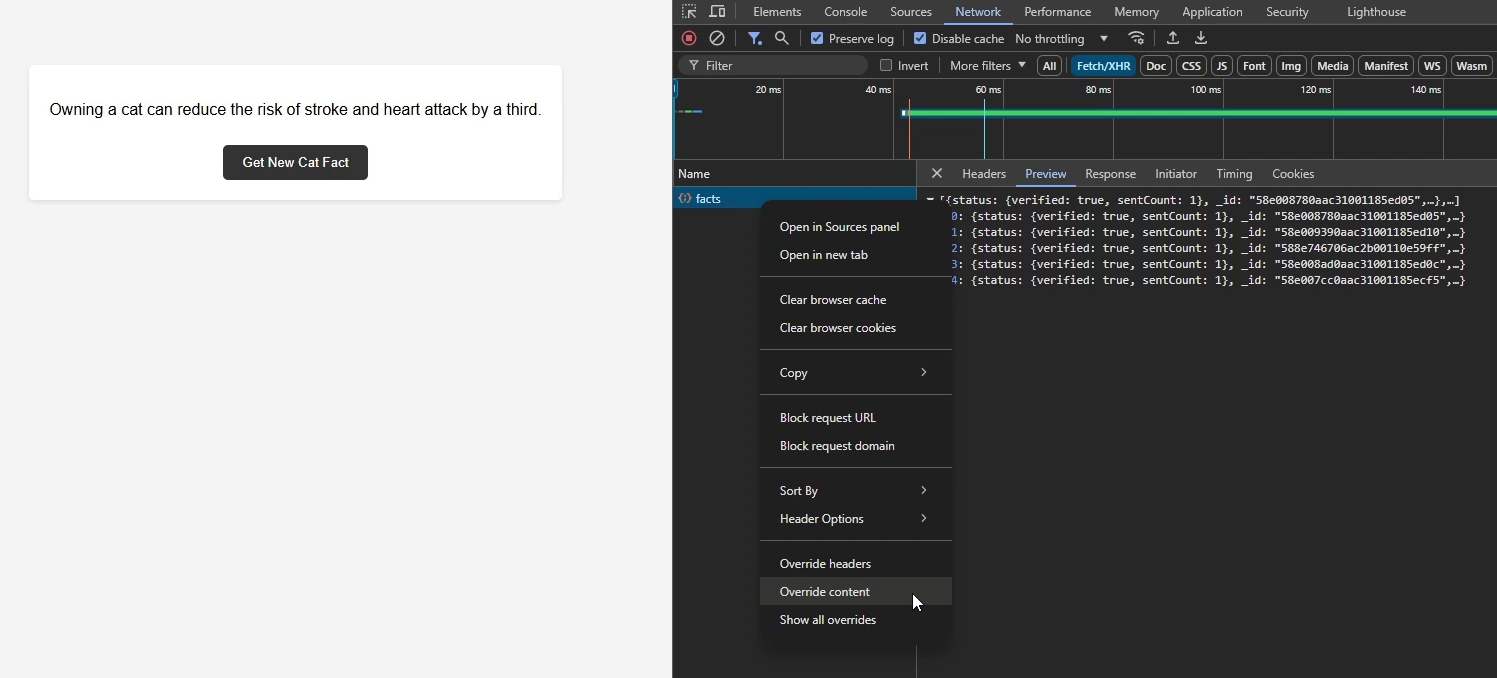

4. Modify the response: Update the response and save your changes.


5. Reload the page: Reload the page to receive the mocked response.


2. Pause Script Execution
The Pause Script Execution feature in Chrome DevTools allows us to freeze the application's state at any given moment. Activated using the F8 key (or by clicking the pause button in the Sources tab), it's an invaluable tool when working with dynamic UIs, animations, or interactive elements.
Why It's Great:
How to Use Pause Script Execution:
1. Open the Sources Tab: In Chrome DevTools, go to the Sources tab.
2. Trigger Pause: Press F8 (or click the pause icon) to stop all JavaScript execution instantly.
3. Inspect State: Once paused, we can navigate the Call Stack, inspect variables, or modify the DOM directly.
4. Resume Execution: Press F8 again to continue running the script.
3. Emulate Vision Deficiencies
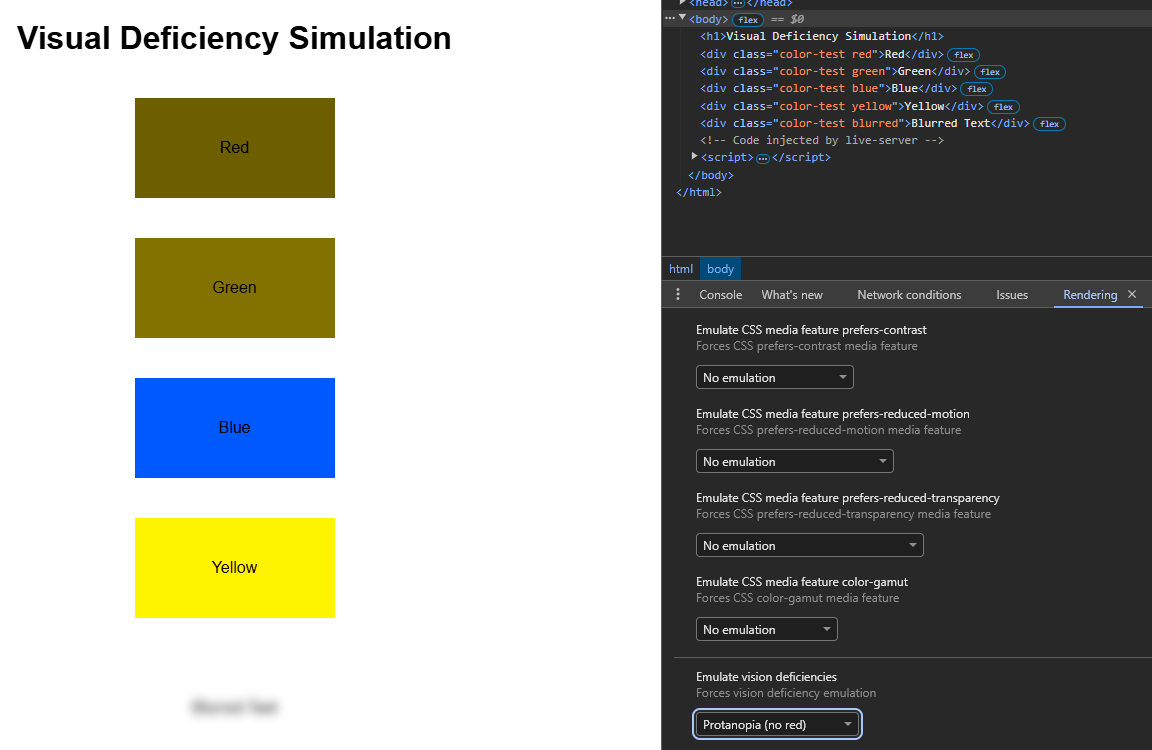
The Emulate Vision Deficiencies feature in Chrome DevTools helps us simulate how users with visual impairments perceive a web application. Located in the Rendering tab, it enables testing for conditions like color blindness and blurred vision. This tool is essential for validating the accessibility and inclusivity of our application's design.
Why It's Great
How to Use Emulate Vision Deficiencies:
1. Open the Rendering Tab: In Chrome DevTools, go to "..." > More Tools > Rendering.


2. Find Vision Deficiencies: Scroll down to the Emulate vision deficiencies dropdown.
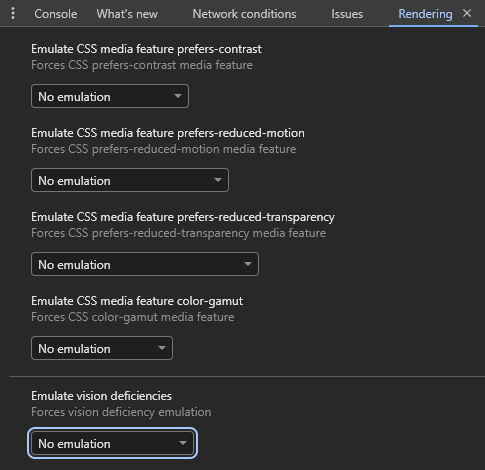

3. Choose a Condition: Select from options like Protanopia (red-green color blindness), Tritanopia (blue-yellow color blindness), or Blurred Vision.
4. Observe the Changes: Watch how the app adjusts under the selected condition.

4. Clear Storage
The Clear Storage feature in the Application tab of Chrome DevTools allows us to quickly and selectively remove browser data like cookies, local storage, cache, and IndexedDB. This feature is particularly useful when testing application behavior tied to persistent data, such as login sessions, user preferences, or caching mechanisms.
Why It's Great:
How to Use Clear Storage:
1. Open the Application Tab: In Chrome DevTools, go to the Application tab.
2. Access Storage: Select Storage from the left-hand menu.
3. Choose Data to Clear: We'll see a checklist of storage types, including local storage, cookies, and cache.
4. Click Clear Site Data: Press the button to delete the selected data types for the current site.
5. Throttle Network Speeds and User Agents
The Network Conditions feature in Chrome DevTools lets us simulate different network speeds and change user agent strings. This is incredibly useful for testing application behavior under slow connections, offline scenarios, or when accessed from various devices. By mimicking real-world conditions, we can identify performance bottlenecks and improve the user experience.
Why It's Great:
How to Use Network Conditions:
1. Open the Network Tab: In Chrome DevTools, go to the Network tab.
2. Access Network Conditions: Click the "..." menu in the top-right corner, then select More Tools > Network Conditions.
3. Throttle Network Speed: Under the Network throttling dropdown, choose a preset (e.g., 3G, offline) or create a custom profile.
4. Change User Agent: Uncheck "Use browser default" under User Agent and select a predefined user agent or input a custom one.
5. Observe Behavior: Reload the page to test how the application performs with the selected settings.
6. $$ Selector and DOM Path Commands
The $$ selector and DOM path commands in the Console tab of Chrome DevTools provide a quick and powerful way to query elements on the page. These features are invaluable when debugging DOM-related issues or writing automated test scripts. They simplify locating and interacting with elements, helping ensure our tests are targeting the right parts of the UI.
Why It's Great:
How to Use the $$ Selector and DOM Path Commands:
1. Open the Console Tab: In Chrome DevTools, go to the Console tab.
2. Use $$ Selector: Type $$('<your-css-selector>') to return an array of matching elements. For example, $$('.button') selects all elements with the button class.
3. Inspect Elements: Click on any element in the returned array to highlight it in the Elements tab.
4. Copy DOM Path: Right-click on an element in the Elements tab, select Copy > Copy JS path.
5. Test the Path: Paste the path in the Console to test its accuracy.
7. Block Request URLs
The Block Request URLs feature in Chrome DevTools allows us to block specific network requests during testing. This is particularly helpful for simulating unavailable resources, testing fallback mechanisms, or isolating frontend behavior from external dependencies like APIs or third-party services.
Why It's Great:
How to Use Block Request URLs:
1. Open the Network Tab: In Chrome DevTools, go to the Network tab and reload the page to capture requests.
2. Block a Request: Right-click on a request in the list, then select Block request URL.
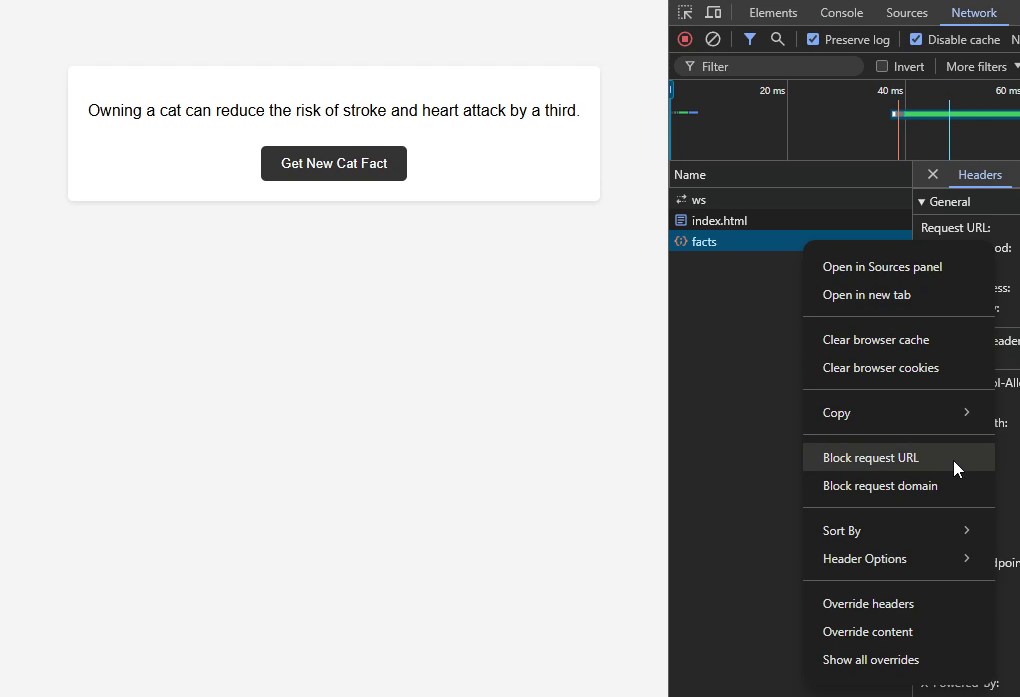

3. Observe Changes: Reload the page to see how the application behaves without the blocked resource.


4. Manage Blocked URLs: Open the Network request blocking panel (via "..." > More Tools) to view or remove blocked URLs under the Blocked URLs section.
Conclusion
Chrome DevTools offers an extensive set of features that can make our job more efficient and effective. From modifying network responses and pausing script execution to emulating user environments and debugging DOM elements, these tools empower us to uncover issues and validate application behavior with precision. By incorporating these features into our testing workflow, we can streamline debugging, enhance test coverage, and ensure a better user experience. Dive into these features today and unlock the full potential of Chrome DevTools in your QA toolkit!